
IMAGE
Fig. S3
- ID
- ZDB-IMAGE-181130-29
- Publication
- Castillo-Robles et al., 2018 - smarce1 mutants have a defective endocardium and an increased expression of cardiac transcription factors in zebrafish
- All Figures
- Figures for Castillo-Robles et al., 2018
Image
|
Figure Caption
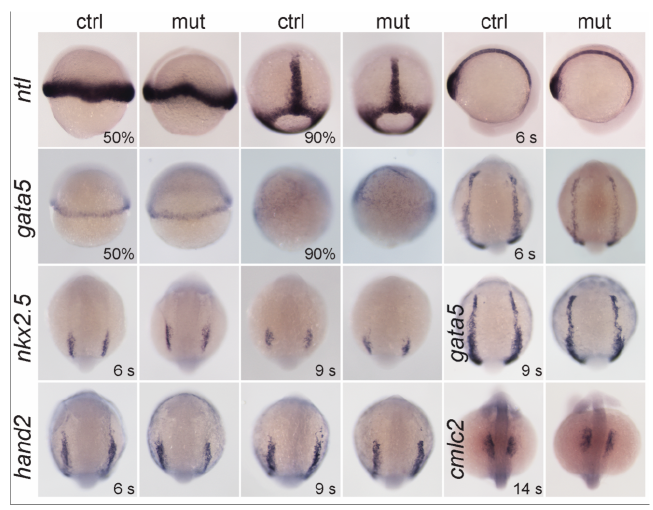
Fig. S3
Gene expression patterns in control and smarce1-/- embryos for the indicated transcripts at the indicated stages (s = somites). Embryos at 50%, and 90% epiboly, dorsal views with anterior to the top. Embryos at 6-somite stage for ntl, lateral views. Embryos at 6-, 9- and 14-somite stage for gata5, hand2, nkx2.5 and cmlc2, dorsal views with anterior to the top.
Acknowledgments
This image is the copyrighted work of the attributed author or publisher, and
ZFIN has permission only to display this image to its users.
Additional permissions should be obtained from the applicable author or publisher of the image.
Full text @ Sci. Rep.