
- Title
-
The inflammatory bowel disease (IBD) susceptibility genes NOD1 and NOD2 have conserved anti-bacterial roles in zebrafish
- Authors
- Oehlers, S.H., Flores, M.V., Hall, C.J., Swift, S., Crosier, K.E., and Crosier, P.S.
- Source
- Full text @ Dis. Model. Mech.
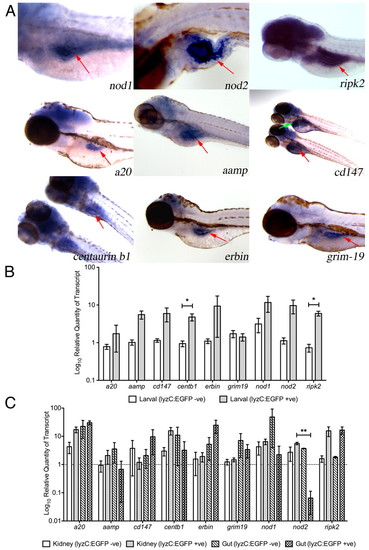
Expression of genes encoding components of the zebrafish Nod signaling pathway. (A) Detection of gene expression, by whole-mount in situ hybridization, in 4 dpf (nod1, ripk2, a20, erbin and grim-19) and 5 dpf (nod2, aamp, cd147 and centaurin b1) zebrafish larvae. All specimens are oriented anterior to the left, posterior to the right. Red arrows indicate the gut. Green arrow indicates liver. (B,C) Differential expression of Nod signaling pathway components in myelomonocytic cells from zebrafish larvae (B) and adults (C). Error bars represent s.e.m.; statistically significant differences of P<0.05 (*) and P<0.01 (**) are marked. |

Nod1 and Nod2 are required for systemic innate immunity in zebrafish embryos. (A) Time course of Tg(lyzC:dsRed)50 embryos injected with PBS or 200 CFU of GFP-tagged S. enterica into the yolk sac at 2 dpf. Scale bar: 1 mm. (B) Survival of embryos infected by yolk sac injection. Data represent means of triplicate replicates; 30 embryos per treatment group. All error bars represent a 95% confidence interval. (C) Scatter plots showing S. enterica CFU counts recovered from individual embryos infected by yolk sac injection with 200 CFU of GFP-tagged S. enterica at 2 dpf. Data represent three biological replicates. Error bars represent s.e.m.; statistically significant differences of P<0.05 (*), P<0.01 (**) and P<0.001 (***) as determined by ANOVA are marked. PHENOTYPE:
|
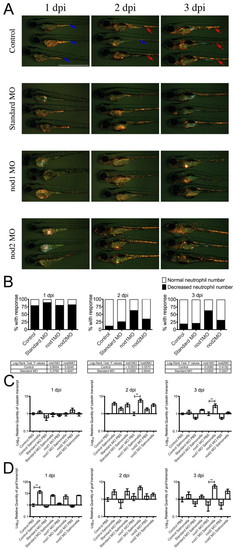
Leukocytic response to yolk sac infection in control and morphant embryos. (A) Time course of Tg(lyzC:dsRed)50 control and morphant embryos infected by yolk sac injection with S. enterica at 2 dpf. In control row: red arrows indicate embryos with a normal number of neutrophils in the CHT; blue arrows indicate embryos with a decreased number of neutrophils in the CHT. Scale bar: 1 mm. (B) Analysis of neutrophil number in the CHT of S. enterica-infected Tg(lyzC:dsRed)50 embryos. Data represents three biological replicates; 50 embryos of each treatment were infected and followed for analysis. (C) Expression of l-plastin analyzed by qPCR. (D) Expression of gcsfr analyzed by qPCR. Data for qPCR experiments represents triplicate pools of five to ten embryos. Error bars represent s.e.m.; statistically significant differences of P<0.01 (**) as determined by ANOVA are marked. |

Depletion of zebrafish Nod1 or Nod2 results in reduced expression of duox and increased S. enterica burden following infection in larvae. (A) Expression of duox examined by qPCR at 6 and 24 hpi. Data represents at least triplicate pools of 10 to 20 larvae. Error bars represent s.e.m.; statistically significant differences of P<0.05 (*), P<0.01 (**) and P<0.0001 (***) as determined by ANOVA are marked. (B) Expression of duox in 4-dpf control and morphant larvae examined by in situ hybridization. Green arrows indicate thyroid expression; red arrows indicate intestinal epithelial cell expression. (C) Whole-larvae and intracellular bacterial recovery from 6 and 24 hpi larvae. Triplicate groups of five larvae were analyzed for each biological replicate represented by a single dot. Error bars represent s.e.m.; statistically significant differences of P<0.05 (*) and P<0.01 (**) as determined by ANOVA are marked. |

Larval expression patterns of zebrafish nod1 and nod2. In situ hybridisation specimens of nod1 (A) and nod2 (B) sectioned and counterstained with Nuclear Fast Red. Photomicrographs are representative of intestinal bulb staining seen with antisense strand but not sense strand probes. Scale bars represent 10 μm, L. indicates lumen of the intestine. |
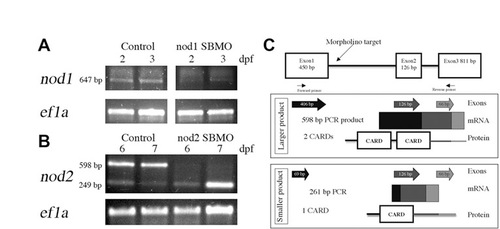
Confirmation of Nod knockdown in zebrafish larvae. RT-PCR detection of (A) nod1 and (B) nod2 transcripts following MO-mediated depletion from 2 and 3 dpf (A) and 6 and 7 dpf (B) larvae. Ef1a was used as a control. (C) In silico analysis of predicted proteins derived from zebrafish Nod2 splice variants. The genomic structure with morpholino target and primer binding sites is shown at top. Exons amplified by RT-PCR are depicted as individual arrows and as a continuous amplicon of mRNA. Predicted protein structure is illustrated with shading indicating the contribution of each exon to the predicted domains. |
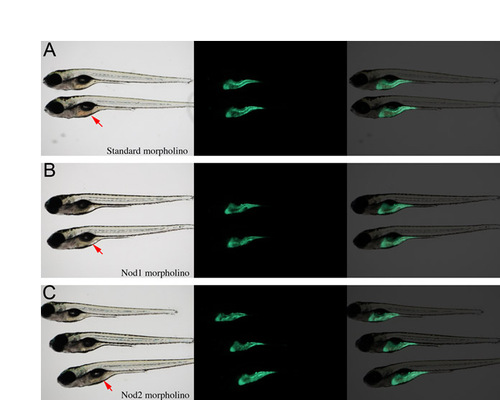
Knockdown of zebrafish Nod1 or Nod2 does not affect gut development. Transgenic ifabp:GFP embryos were injected with (A) standard control, (B) Nod1 or (C) Nod2 morpholinos. Gut architecture was observed under epifluorescence. Red arrows indicate the gut. |
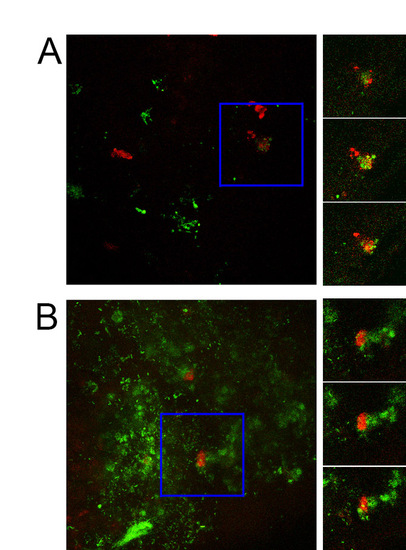
Confocal imaging demonstrates phagocytosis of GFP-labelled S. enterica by zebrafish neutrophils. Images on left are maximum intensity Z-projections of 1 dpi (A) and 2 dpi (B) Tg(lyzC:dsRed)50 embryos injected with 200 CFU of GFP-tagged S. enterica into the yolk sac at 2 dpf. Blue box demarcates area of interest. Images on right show three consecutives slices from confocal stack from the area of interest. |