
Fig. 3
- ID
- ZDB-IMAGE-111215-11
- Publication
- Oehlers et al., 2011 - The inflammatory bowel disease (IBD) susceptibility genes NOD1 and NOD2 have conserved anti-bacterial roles in zebrafish
- All Figures
- Figures for Oehlers et al., 2011
|
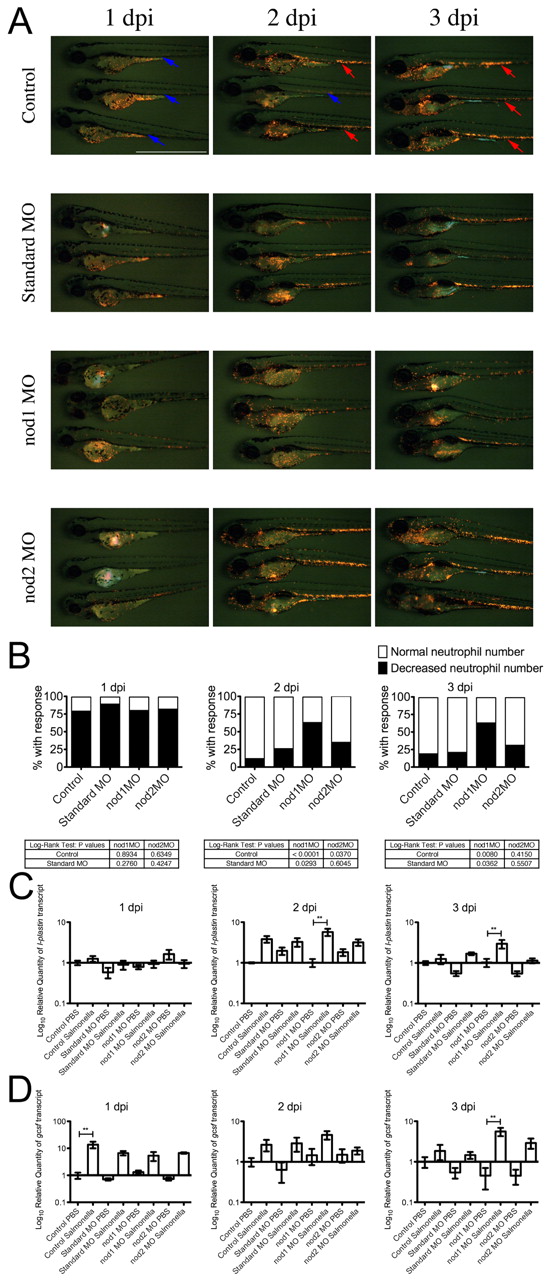
Fig. 3 Leukocytic response to yolk sac infection in control and morphant embryos. (A) Time course of Tg(lyzC:dsRed)50 control and morphant embryos infected by yolk sac injection with S. enterica at 2 dpf. In control row: red arrows indicate embryos with a normal number of neutrophils in the CHT; blue arrows indicate embryos with a decreased number of neutrophils in the CHT. Scale bar: 1 mm. (B) Analysis of neutrophil number in the CHT of S. enterica-infected Tg(lyzC:dsRed)50 embryos. Data represents three biological replicates; 50 embryos of each treatment were infected and followed for analysis. (C) Expression of l-plastin analyzed by qPCR. (D) Expression of gcsfr analyzed by qPCR. Data for qPCR experiments represents triplicate pools of five to ten embryos. Error bars represent s.e.m.; statistically significant differences of P<0.01 (**) as determined by ANOVA are marked.