
Fig. 4
- ID
- ZDB-FIG-250324-11
- Publication
- Kroll et al., 2025 - Behavioural pharmacology predicts disrupted signalling pathways and candidate therapeutics from zebrafish mutants of Alzheimer's disease risk genes
- Other Figures
-
- Fig. 1
- Fig. 1 - Supplemental 1
- Fig. 2
- Fig. 2 - Supplemental 1
- Fig. 2 - Supplemental 2
- Fig. 3
- Fig. 3 - Supplemental 1
- Fig. 3 - Supplemental 2
- Fig. 3 - Supplemental 3
- Fig. 3 - Supplemental 4
- Fig. 4
- Fig. 4 - Supplemental 1
- Fig. 4 - Supplemental 2
- Fig. 4 - Supplemental 3
- Fig. 4 - Supplemental 4
- Fig. 4 - Supplemental 5
- Fig. 5
- Fig. 5 - Supplemental 1
- Fig. 6
- Fig. 6 - Supplemental 1
- Fig. 7
- All Figure Page
- Back to All Figure Page
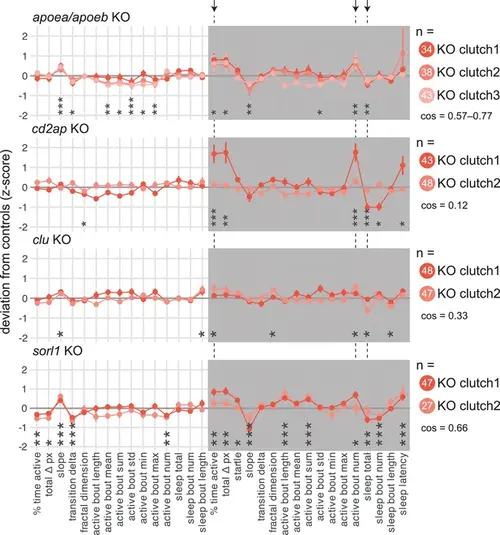
F0 knockout larvae in genes associated with late-onset Alzheimer’s disease sleep less at night. For each gene: behavioural fingerprints of N = 2–3 clutches of F0 knockout larvae. Each dot represents the mean deviation from the same-clutch scrambled-injected mean for that parameter (z-score, mean ± SEM). Asterisks represent the p-values by likelihood-ratio test on linear mixed effects models calculated on the raw parameter values. cos, cosine similarities between fingerprints. Arrows and dashed lines mark the three parameters which are significant for all four late-onset Alzheimer’s risk genes tested. |