
Fig. 1
- ID
- ZDB-FIG-250324-1
- Publication
- Kroll et al., 2025 - Behavioural pharmacology predicts disrupted signalling pathways and candidate therapeutics from zebrafish mutants of Alzheimer's disease risk genes
- Other Figures
-
- Fig. 1
- Fig. 1 - Supplemental 1
- Fig. 2
- Fig. 2 - Supplemental 1
- Fig. 2 - Supplemental 2
- Fig. 3
- Fig. 3 - Supplemental 1
- Fig. 3 - Supplemental 2
- Fig. 3 - Supplemental 3
- Fig. 3 - Supplemental 4
- Fig. 4
- Fig. 4 - Supplemental 1
- Fig. 4 - Supplemental 2
- Fig. 4 - Supplemental 3
- Fig. 4 - Supplemental 4
- Fig. 4 - Supplemental 5
- Fig. 5
- Fig. 5 - Supplemental 1
- Fig. 6
- Fig. 6 - Supplemental 1
- Fig. 7
- All Figure Page
- Back to All Figure Page
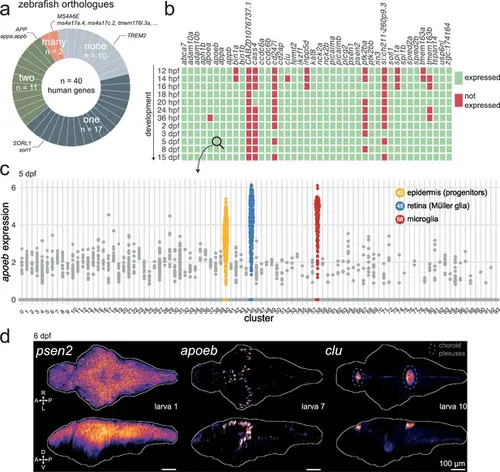
Most Alzheimer’s risk genes are found in zebrafish and expressed early in development. (a) Of 40 Alzheimer’s risk genes, 17 had one orthologue in zebrafish; 11 had two orthologues; 2 had more than two orthologues; and 10 did not have any annotated orthologue. More details about orthologues of Alzheimer’s risk genes are provided in Supplementary file 1 (source: Ensembl). (b) Expression of Alzheimer’s risk genes during early development in zebrafish. Genes were marked as ‘expressed’ (green) if at least three cells had detectable transcripts in the single-cell RNA-seq dataset from Raj et al., 2020. CABZ01076737.1 is the orthologue of TSPOAP1; cd247l is the orthologue of FCER1G; si:ch211-260p9.3 is an orthologue of PLCG2; zgc:174164 is an orthologue of ADAM10. Other genes have the same name as their human orthologue. The orthologues of MS4A6E were not included. hpf, hours post-fertilisation; dpf, days post-fertilisation.(c) Expression of apoeb in cells of the nervous system at 5 dpf. Each dot represents one cell. Cells are grouped by cluster identity, which are provided in Supplementary file 1. Single-cell RNA-seq data and clustering from Raj et al., 2020. (d) In situ hybridization chain reactions labelling psen2, apoeb, or clu mRNA in the brains of 6-dpf larvae. The images are maximum Z-projections of dorsal (top) and sagittal (bottom) views of three larvae. A, anterior; P, posterior; R, rightwards; L, leftwards; D, dorsal; V, ventral. Larva # labels individual animals across this figure and Figure 1—figure supplements 3 and 4. See also Figure 1—videos 1–9. |