
Fig. 7
- ID
- ZDB-FIG-250324-21
- Publication
- Kroll et al., 2025 - Behavioural pharmacology predicts disrupted signalling pathways and candidate therapeutics from zebrafish mutants of Alzheimer's disease risk genes
- Other Figures
-
- Fig. 1
- Fig. 1 - Supplemental 1
- Fig. 2
- Fig. 2 - Supplemental 1
- Fig. 2 - Supplemental 2
- Fig. 3
- Fig. 3 - Supplemental 1
- Fig. 3 - Supplemental 2
- Fig. 3 - Supplemental 3
- Fig. 3 - Supplemental 4
- Fig. 4
- Fig. 4 - Supplemental 1
- Fig. 4 - Supplemental 2
- Fig. 4 - Supplemental 3
- Fig. 4 - Supplemental 4
- Fig. 4 - Supplemental 5
- Fig. 5
- Fig. 5 - Supplemental 1
- Fig. 6
- Fig. 6 - Supplemental 1
- Fig. 7
- All Figure Page
- Back to All Figure Page
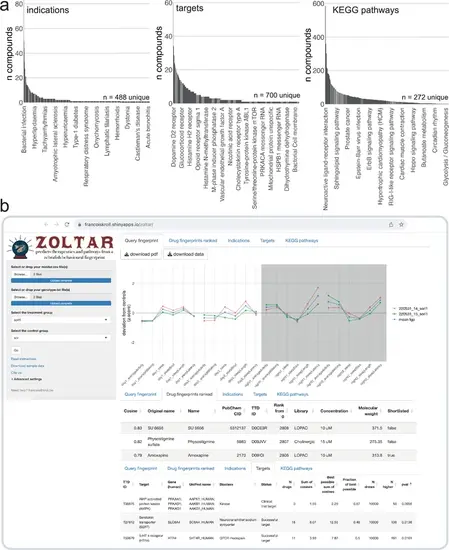
The ZOLTAR online app for prediction of therapeutics and disrupted processes from behavioural fingerprints. (a) Datasets currently available to the ZOLTAR online app for predictions. The height of each bar represents the number of unique compounds with this annotation. Some annotations are labelled as examples. Of 3677 unique compounds labelled with a PubChem ID, 1123 were annotated with one or more indications; 1552 were annotated with one or more target proteins; and 1140 were annotated with one or more KEGG pathways through their targets. Source of annotations: Therapeutic Target Database. (b) Screenshot showing some of the features of the ZOLTAR online app. User drags and drops data file(s) (middur = sec active/min for each larva) and file(s) labelling each well with a condition (called ‘genotype file’, but can be any group assignments). The app reads the groups from the genotype file(s) and the user selects the treatment and control groups in a dropdown menu. The app calculates and plots the fingerprint(s) (tab Query fingerprint), then ranks the 5756 small molecule fingerprints (tab Drug fingerprints ranked) from maximum positive cosine to maximum negative cosine. Clicking on a row in the table of ranked compounds plots all the fingerprints of this compound (all fingerprints with the same PubChem ID) in comparison with the query fingerprint, as in Figure 6a. The app tests, for each annotation, enrichment towards the top and/or bottom of the ranked list with a custom permutation test. Current annotations are clinical indications (tab Indications), target proteins (tab Targets), and the KEGG pathways each target protein is associated with (tab KEGG pathways). Clicking on a row in a table of annotation results generates the ‘barcode plot’ for this annotation, as in Figure 5a. The tables can be downloaded as .csv files and the plots as .pdf files. |