
Fig. 4 - Supplemental 2
- ID
- ZDB-FIG-250324-13
- Publication
- Kroll et al., 2025 - Behavioural pharmacology predicts disrupted signalling pathways and candidate therapeutics from zebrafish mutants of Alzheimer's disease risk genes
- Other Figures
-
- Fig. 1
- Fig. 1 - Supplemental 1
- Fig. 2
- Fig. 2 - Supplemental 1
- Fig. 2 - Supplemental 2
- Fig. 3
- Fig. 3 - Supplemental 1
- Fig. 3 - Supplemental 2
- Fig. 3 - Supplemental 3
- Fig. 3 - Supplemental 4
- Fig. 4
- Fig. 4 - Supplemental 1
- Fig. 4 - Supplemental 2
- Fig. 4 - Supplemental 3
- Fig. 4 - Supplemental 4
- Fig. 4 - Supplemental 5
- Fig. 5
- Fig. 5 - Supplemental 1
- Fig. 6
- Fig. 6 - Supplemental 1
- Fig. 7
- All Figure Page
- Back to All Figure Page
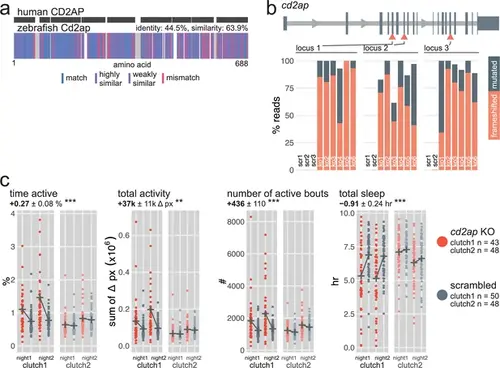
cd2ap F0 knockouts are hyperactive at night. (a) Human CD2AP amino acid sequence (top) aligned to zebrafish Cd2ap amino acid sequence (bottom). In the zebrafish protein, each amino acid (vertical bar) is coloured based on its similarity with the human protein. White gaps are added when additional residues are present in the other sequence. (b) (top) Schematic of cd2ap in the 5′–3′ genome direction. Exons are in dark grey; tall exons are protein-coding, small are 5′- or 3′-UTR. Light grey lines are introns, and grey arrows represent the direction of transcription. Orange arrowheads mark the target loci. Exons and introns are on different scales. (bottom) Percentage of reads mutated (height of each bar, with orange representing percentage with a frameshift mutation) at each targeted locus of cd2ap. scr, scrambled-injected control larva; ko, cd2ap F0 knockout larva. The numbers refer to individual animals. For example, ko1 refers to an individual cd2ap F0 knockout larva for which mutations at each targeted locus are plotted. Across F0 knockout samples: 94.3 ± 9.8% mutated reads, 72.1 ± 20.3% of all reads had a frameshift mutation. (c) Parameter plots for two clutches of cd2ap F0 knockout larvae and scrambled-injected siblings. Each dot represents one larva during one night. Black crosses mark the group means. At night, cd2ap F0 knockouts spent more time active (time active, *** p<0.001), displaced more pixels in total (total activity, ** p=0.001), initiated more swimming bouts (number of active bouts, *** p<0.001), and slept less (total sleep, *** p<0.001) than scrambled-injected siblings. Three datapoints from two cd2ap F0 knockout larvae (clutch1) fall outside the Y axis limit of the time active plot (5.1–5.8 hr). One datapoint from a cd2ap F0 knockout larvae (clutch1) falls outside the Y axis limit of the total activity plot (1.2×10⁶ Δ px). |