
Fig. 3 - Supplemental 1
- ID
- ZDB-FIG-250324-7
- Publication
- Kroll et al., 2025 - Behavioural pharmacology predicts disrupted signalling pathways and candidate therapeutics from zebrafish mutants of Alzheimer's disease risk genes
- Other Figures
-
- Fig. 1
- Fig. 1 - Supplemental 1
- Fig. 2
- Fig. 2 - Supplemental 1
- Fig. 2 - Supplemental 2
- Fig. 3
- Fig. 3 - Supplemental 1
- Fig. 3 - Supplemental 2
- Fig. 3 - Supplemental 3
- Fig. 3 - Supplemental 4
- Fig. 4
- Fig. 4 - Supplemental 1
- Fig. 4 - Supplemental 2
- Fig. 4 - Supplemental 3
- Fig. 4 - Supplemental 4
- Fig. 4 - Supplemental 5
- Fig. 5
- Fig. 5 - Supplemental 1
- Fig. 6
- Fig. 6 - Supplemental 1
- Fig. 7
- All Figure Page
- Back to All Figure Page
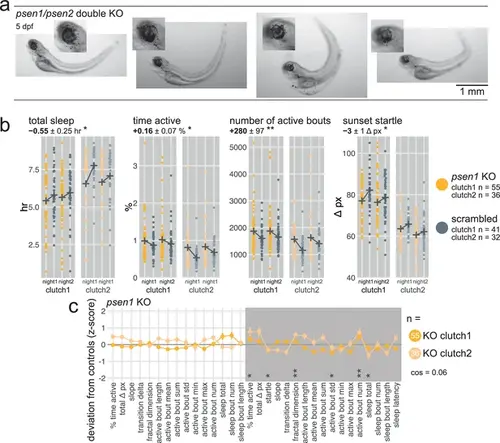
psen1 F0 knockouts are slightly hyperactive at night. (a) Pictures of psen1/psen2 double F0 knockout larvae (5 dpf). Note patchy retinal pigment epithelium and eye oedema (insets). (b) Parameter plots for two clutches of psen1 F0 knockout larvae and scrambled-injected siblings. Each dot represents one larva during one night. Black crosses mark the group means. At night, psen1 F0 knockouts slept less (total sleep, * p=0.030), spent more time active (time active, * p=0.018), and initiated more swimming bouts (number of active bouts, ** p=0.004) than scrambled-injected siblings. The startle response of psen1 F0 knockouts was also slightly suppressed (sunset startle, * p=0.015). Statistics by likelihood-ratio test on linear mixed effects models. (c) Behavioural fingerprints of two clutches of psen1 F0 knockout larvae. Each dot represents the mean deviation from the same-clutch scrambled-injected mean for that parameter (z-score, mean ± SEM). Asterisks represent the p-values by likelihood-ratio test on linear mixed effects models calculated on the raw parameter values, as in (b). cos, cosine similarity between the two clutch fingerprints. |