
Fig. 5
- ID
- ZDB-FIG-250324-17
- Publication
- Kroll et al., 2025 - Behavioural pharmacology predicts disrupted signalling pathways and candidate therapeutics from zebrafish mutants of Alzheimer's disease risk genes
- Other Figures
-
- Fig. 1
- Fig. 1 - Supplemental 1
- Fig. 2
- Fig. 2 - Supplemental 1
- Fig. 2 - Supplemental 2
- Fig. 3
- Fig. 3 - Supplemental 1
- Fig. 3 - Supplemental 2
- Fig. 3 - Supplemental 3
- Fig. 3 - Supplemental 4
- Fig. 4
- Fig. 4 - Supplemental 1
- Fig. 4 - Supplemental 2
- Fig. 4 - Supplemental 3
- Fig. 4 - Supplemental 4
- Fig. 4 - Supplemental 5
- Fig. 5
- Fig. 5 - Supplemental 1
- Fig. 6
- Fig. 6 - Supplemental 1
- Fig. 7
- All Figure Page
- Back to All Figure Page
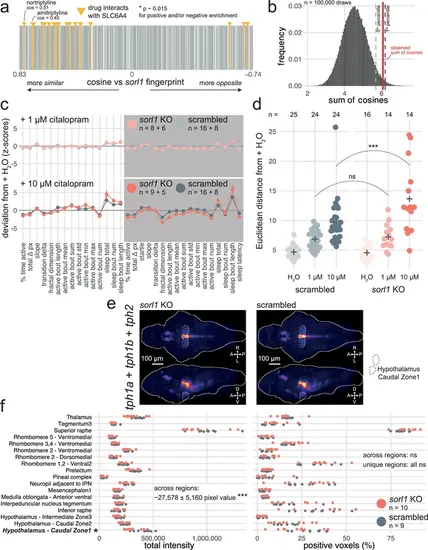
Predictive behavioural pharmacology identifies impaired serotonin signalling in sorl1 knockouts. (a) Compounds interacting with the serotonin transporter SLC6A4 tend to generate behavioural phenotypes similar to the sorl1 F0 knockout fingerprint. 2674 compound–target protein pairs (vertical bars; 1552 unique compounds) are ranked from the fingerprint with the most positive cosine to the fingerprint with the most negative cosine in comparison with the mean sorl1 F0 knockout fingerprint. Fingerprints of compounds that interact with SLC6A4 are coloured in yellow (source: Therapeutic Target Database). Simulated p-value = 0.015 for enrichment of drugs interacting with SLC6A4 at the top (positive cosine) and/or bottom (negative cosine) of the ranked list by a custom permutation test. (b) Result of the permutation test for top and/or bottom enrichment of drugs interacting with SLC6A4 in the ranked list. The absolute cosines of the fingerprints of drugs interacting with SLC6A4 (n=18, one fingerprint per compound) were summed, giving sum of cosines = 6.1. To simulate a null distribution, 18 fingerprints were randomly drawn 100,000 times, generating a distribution of 100,000 random sum of cosines. Here, only 1470 random draws gave a larger sum of cosines, so the simulated p-value was p = 1470/100,000 = 0.015 *. (c) (top) Behavioural fingerprints of sorl1 F0 knockouts and scrambled-injected siblings treated with 1 µM citalopram. (bottom) Behavioural fingerprints of sorl1 F0 knockouts and scrambled-injected siblings treated with 10 µM citalopram. In both plots, each dot represents the mean deviation from the mean of the same-group (F0 knockout or scrambled-injected) untreated (H2O) siblings (z-score, mean ± SEM); therefore, the baseline (z-scores = 0) does not represent the same larvae for sorl1 F0 knockouts and scrambled-injected controls. Z-scores from two clutches were averaged. (d) Euclidean distance from same-group controls’ mean across the 32 parameters. ns p=0.71, *** p<0.001 by Welch’s t-test. (e) HCRs labelling transcripts encoding serotonin transporters (slc6a4a and slc6a4b) in 6-dpf sorl1 F0 knockouts and scrambled-injected controls. The images are maximum Z-projections of dorsal (top) and sagittal (bottom) views of the median stack of all larvae in each group. A, anterior; P, posterior; R, rightwards; L, leftwards; D, dorsal; V, ventral. (f) Quantification of HCRs from (c). (left) Total grey pixel intensity per anatomical region in sorl1 F0 knockouts and scrambled-injected controls. Across regions: ns p=0.98; unique regions: ns p>0.25. (right) Number of voxels with positive signal per anatomical region in sorl1 F0 knockouts and scrambled-injected controls. ** p=0.001, unique regions: ns p>0.07. Statistics across regions by likelihood-ratio test on linear mixed effects models; statistics on unique regions by Welch’s t-test without p-value adjustment. The same larvae are plotted in Figure 5—figure supplement 1e f. |