
Fig. 4 - Supplemental 4
- ID
- ZDB-FIG-250324-15
- Publication
- Kroll et al., 2025 - Behavioural pharmacology predicts disrupted signalling pathways and candidate therapeutics from zebrafish mutants of Alzheimer's disease risk genes
- Other Figures
-
- Fig. 1
- Fig. 1 - Supplemental 1
- Fig. 2
- Fig. 2 - Supplemental 1
- Fig. 2 - Supplemental 2
- Fig. 3
- Fig. 3 - Supplemental 1
- Fig. 3 - Supplemental 2
- Fig. 3 - Supplemental 3
- Fig. 3 - Supplemental 4
- Fig. 4
- Fig. 4 - Supplemental 1
- Fig. 4 - Supplemental 2
- Fig. 4 - Supplemental 3
- Fig. 4 - Supplemental 4
- Fig. 4 - Supplemental 5
- Fig. 5
- Fig. 5 - Supplemental 1
- Fig. 6
- Fig. 6 - Supplemental 1
- Fig. 7
- All Figure Page
- Back to All Figure Page
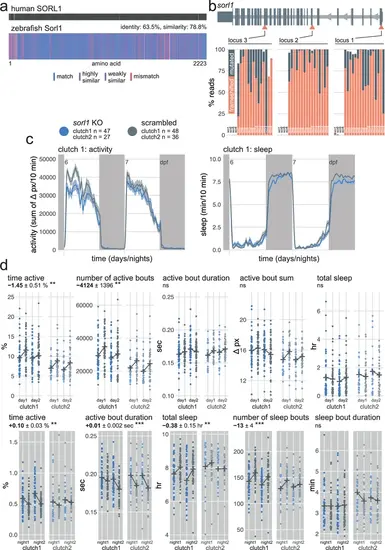
sorl1 F0 knockouts are hypoactive during the day but hyperactive at night. (a) Human SORL1 amino acid sequence (top) aligned to zebrafish Sorl1 amino acid sequence (bottom). In the zebrafish protein, each amino acid (vertical bar) is coloured based on its similarity with the human protein. White gaps are added when additional residues are present in the other sequence. (b) (top) Schematic of sorl1 in the 5′–3′ genome direction. Exons are in dark grey; tall exons are protein-coding, small are 5′- or 3′-UTR. Light grey lines are introns, and grey arrows represent the direction of transcription. Orange arrowheads mark the target loci. Exons and introns are on different scales. (bottom) Percentage of reads mutated (height of each bar, with orange representing percentage with a frameshift mutation) at each targeted locus of sorl1. scr, scrambled-injected control larva; ko, sorl1 F0 knockout larva. The numbers refer to individual animals. For example, ko6 refers to an individual sorl1 F0 knockout larva for which mutations at each targeted locus are plotted. Across F0 knockout samples: 98.2 ± 5.4% mutated reads, 73.9 ± 23.8% of all reads had a frameshift mutation. (c) (left) Activity (sum of Δ pixels/10 min) of sorl1 F0 knockout larvae and scrambled-injected siblings during 48 hr on a 14 hr:10 hr light:dark cycle (white background for days, dark grey background for nights). (right) Sleep (minutes per 10-min epoch) during the same experiment. Traces are mean ± SEM across larvae. See also Figure 4—figure supplement 5 for results from replicate clutch 2. (d) Parameter plots for two clutches of sorl1 F0 knockout larvae and scrambled-injected siblings. Each dot represents one larva during one day (top row) or night (bottom row). Black crosses mark the group means. (top row) During the day, sorl1 F0 knockouts spent less time active (time active, ** p=0.005) and initiated fewer swimming bouts (number of active bouts, ** p=0.004) than scrambled-injected controls. The average duration and number of pixels each swimming bout displaced were not affected by the loss of Sorl1 (active bout duration, ns p=0.40; active bout sum, ns p=0.84). Sleep was also not affected (total sleep, ns p=0.98). (bottom row) During the night, sorl1 F0 knockouts spent more time active (time active, ** p=0.002) and their swimming bouts lasted longer on average (active bout duration, *** p<0.001) than scrambled-injected siblings. sorl1 F0 knockouts also slept less (total sleep, ** p=0.001), mainly because they initiated fewer sleep bouts (number of sleep bouts, *** p<0.001), while the duration of each sleep bout remained broadly unchanged (sleep bout duration, ns p=0.69). One scrambled-injected larva from clutch 2 falls outside the Y axis limit of sleep bout duration (night1: 16.1 min, night2: 12.3 min). Statistics by likelihood-ratio test on linear mixed effects models. |