
Fig. 3 - Supplemental 4
- ID
- ZDB-FIG-250324-10
- Publication
- Kroll et al., 2025 - Behavioural pharmacology predicts disrupted signalling pathways and candidate therapeutics from zebrafish mutants of Alzheimer's disease risk genes
- Other Figures
-
- Fig. 1
- Fig. 1 - Supplemental 1
- Fig. 2
- Fig. 2 - Supplemental 1
- Fig. 2 - Supplemental 2
- Fig. 3
- Fig. 3 - Supplemental 1
- Fig. 3 - Supplemental 2
- Fig. 3 - Supplemental 3
- Fig. 3 - Supplemental 4
- Fig. 4
- Fig. 4 - Supplemental 1
- Fig. 4 - Supplemental 2
- Fig. 4 - Supplemental 3
- Fig. 4 - Supplemental 4
- Fig. 4 - Supplemental 5
- Fig. 5
- Fig. 5 - Supplemental 1
- Fig. 6
- Fig. 6 - Supplemental 1
- Fig. 7
- All Figure Page
- Back to All Figure Page
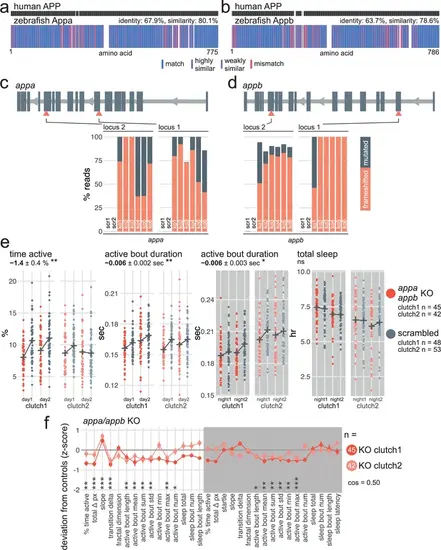
appa/appb F0 knockouts have subdued swimming bouts throughout the day/night cycle. (a) Human APP amino acid sequence (top) aligned to zebrafish Appa amino acid sequence (bottom). In the zebrafish protein, each amino acid (vertical bar) is coloured based on its similarity with the human protein. White gaps are added when additional residues are present in the other sequence. (b) Human APP amino acid sequence (top) aligned to zebrafish Appb amino acid sequence (bottom), as in (a). (c) (top) Schematic of appa in the 5′–3′ genome direction. Exons are in dark grey; tall exons are protein-coding, small are 5′- or 3′-UTR. Light grey lines are introns, and grey arrows represent the direction of transcription. Orange arrowheads mark the target loci. Exons and introns are on different scales. (bottom) Percentage of reads mutated (height of each bar, with orange representing percentage with a frameshift mutation) at each targeted locus of appa. scr, scrambled-injected control larva; ko, appa F0 knockout larva. Across F0 knockout samples: 96.6 ± 8.4% mutated reads, 70.4 ± 23.2% of all reads had a frameshift mutation. (d) (top) Schematic of appb, as in (c). (bottom) Percentage of reads mutated (height of each bar, with orange representing percentage with a frameshift mutation) at each targeted locus of appb. scr, scrambled-injected control larva; ko, appb F0 knockout larva. Across F0 knockout samples: 95.0 ± 5.6% mutated reads, 82.6 ± 19.0% of all reads had a frameshift mutation. In (c) and (d), the numbers refer to individual animals. For example, ko5 refers to an individual appa/appb double F0 knockout larva for which mutations at the four targeted loci are plotted. (e) Parameter plots for two clutches of appa/appb F0 knockout larvae and scrambled-injected siblings. Each dot represents one larva during one day (left) or night (right). Black crosses mark the group means. Compared to scrambled-injected controls, appa/appb F0 knockouts spent less time active during the day (time active, ** p=0.002) and had shorter swimming bouts across the day/night cycle (active bout duration, day: ** p=0.003; night: * p=0.018). Sleep was not affected (sleep total, ns p=0.71). Statistics by likelihood-ratio test on linear mixed effects models. (f) Behavioural fingerprints of two clutches of appa/appb double F0 knockout larvae. Each dot represents the mean deviation from the same-clutch scrambled-injected mean for that parameter (z-score, mean ± SEM). Asterisks represent the p-values by likelihood-ratio test on linear mixed effects models calculated on the raw parameter values. cos, cosine similarity between the two clutch fingerprints. |