
Fig. 3
- ID
- ZDB-FIG-250324-6
- Publication
- Kroll et al., 2025 - Behavioural pharmacology predicts disrupted signalling pathways and candidate therapeutics from zebrafish mutants of Alzheimer's disease risk genes
- Other Figures
-
- Fig. 1
- Fig. 1 - Supplemental 1
- Fig. 2
- Fig. 2 - Supplemental 1
- Fig. 2 - Supplemental 2
- Fig. 3
- Fig. 3 - Supplemental 1
- Fig. 3 - Supplemental 2
- Fig. 3 - Supplemental 3
- Fig. 3 - Supplemental 4
- Fig. 4
- Fig. 4 - Supplemental 1
- Fig. 4 - Supplemental 2
- Fig. 4 - Supplemental 3
- Fig. 4 - Supplemental 4
- Fig. 4 - Supplemental 5
- Fig. 5
- Fig. 5 - Supplemental 1
- Fig. 6
- Fig. 6 - Supplemental 1
- Fig. 7
- All Figure Page
- Back to All Figure Page
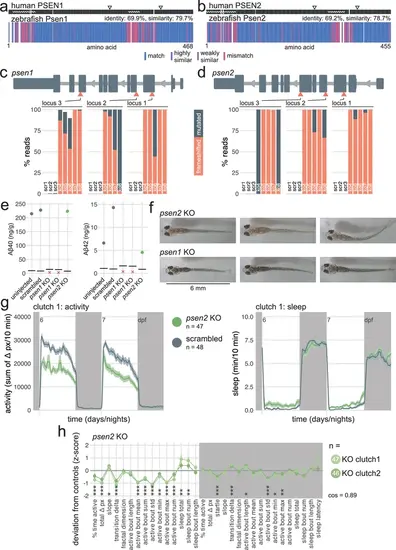
psen2 F0 knockouts initiate more sleep bouts during the day. (a) Human PSEN1 amino acid sequence (top) aligned to zebrafish Psen1 amino acid sequence (bottom). In the zebrafish protein, each amino acid (vertical bar) is coloured based on its similarity with the human protein. In the human protein, wavy lines represent disordered domains and arrowheads point to the two active sites at residues 257 and 385 (source: UniProt). White gaps are added when additional residues are present in the other sequence. (b) Human PSEN2 amino acid sequence (top) aligned to zebrafish Psen2 amino acid sequence (bottom), as in (a). Active sites are at residues 263 and 366 (source: UniProt and AlphaFold). (c) (above) Schematic of psen1 in the 5′–3′ genome direction. Exons are in dark grey; tall exons are protein-coding, small are 5′- or 3′-UTR. Light grey lines are introns, and grey arrows represent the direction of transcription. Orange arrowheads mark the target loci. Exons and introns are on different scales. (below) Percentage of reads mutated (height of each bar, with orange representing percentage with a frameshift mutation) at each targeted locus of psen1. scr, scrambled-injected control larva; ko, psen1 F0 knockout larva. The numbers refer to individual animals. For example, ko4 refers to an individual psen1 F0 knockout larva for which mutations at each targeted locus are plotted. Across F0 knockout samples: 99.0 ± 2.7% mutated reads, 78.6 ± 29.7% of all reads had a frameshift mutation. (d) (above) Schematic of psen2 in the 5′–3′ genome direction, as in (c). (below) Percentage of reads mutated and frameshifted at each targeted locus of psen2, as in (c). Across F0 knockout samples: 99.9 ± 0.1% mutated reads, 82.0 ± 33.6% of all reads had a frameshift mutation. (e) Concentration of Aβ40 and Aβ42 in pools of n=16–22 uninjected, scrambled-injected, psen1 F0 knockout, and psen2 F0 knockout 16-dpf larvae. Each datapoint is the mean of four technical replicates. Concentration unit is ng of Aβ40/42 per g of total protein extracted. Horizontal black line represents the limit of detection. Red crosses indicate samples for which all technical replicates were below the limit of detection. All Aβ38 measurements were below the limit of detection and are not plotted. (f) Pictures of psen2 (top row) and psen1 (bottom row) F0 knockout larvae at 16 dpf. Note the fainter pigmentation of psen2 F0 knockout larvae. (g) (left) Activity (sum of Δ pixels/10 min) of psen2 F0 knockout larvae and scrambled-injected siblings during 48 hr on a 14 hr:10 hr light:dark cycle (white background for days, dark grey background for nights). (right) Sleep (minutes per 10 min epoch) during the same experiment. Traces are mean ± SEM across larvae. See also Figure 3—figure supplement 2a for results from replicate clutch 2. (h) Behavioural fingerprints of two clutches of psen2 F0 knockout larvae. Each dot represents the mean deviation from the same-clutch scrambled-injected mean for that parameter (z-score, mean ± SEM). Asterisks represent the p-values by likelihood-ratio test on linear mixed effects models calculated on the raw parameter values. cos, cosine similarity between the two clutch fingerprints. |