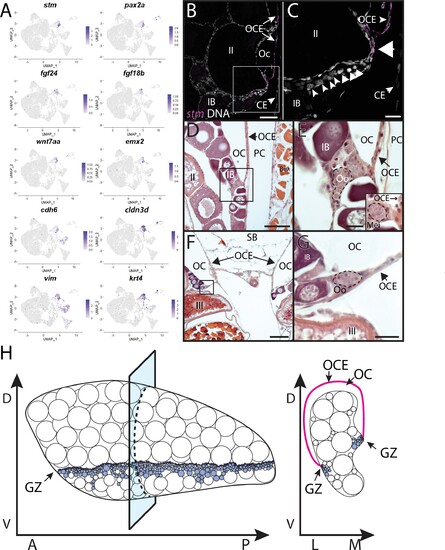
(A) Gene expression uniform manifold approximation and projection (UMAP) plots for select genes whose expression is enriched in stromal cell subcluster 3. (B) Hybridization chain reaction RNA fluorescent in situ hybridization (HCR RNA-FISH) on transverse sections from a 3-month-old ovary showing that stm (magenta) is expressed in the epithelium that lines the ovarian cavity (OC). DNA is gray. (C) Higher magnification of region boxed in (B) showing that early-stage germ cells localize to the region subjacent to where the OCE is attached to the lateral side of the ovary (arrowhead). (D, E) Histological transverse sections from a 3-month-old ovary showing correlation between where the OCE attaches to the ovary at the lateral (D, E) and medial (F, G) sides, and the presence of premeiotic germ cells, characterized by large, dark staining nucleoli, and early meiotic germ cells, characterized by condensed chromosomes (inset in E). (E) and (F) are higher-magnification views of regions boxed in (D) and (F), respectively. PC, peritoneal cavity; CE, coelomic epithelium; SB, swim bladder; Oo, premeiotic oogonia; Mei, early meiotic germ cell; IB, stage IB oocyte; III, stage III oocyte. Scale bar in (C, E, G) 10 µm; (B) 100 µm; (D) 200 µm; (F) 250 µm.