
Fig. 9
- ID
- ZDB-FIG-220622-25
- Publication
- Liu et al., 2022 - Single-cell transcriptome reveals insights into the development and function of the zebrafish ovary
- Other Figures
- All Figure Page
- Back to All Figure Page
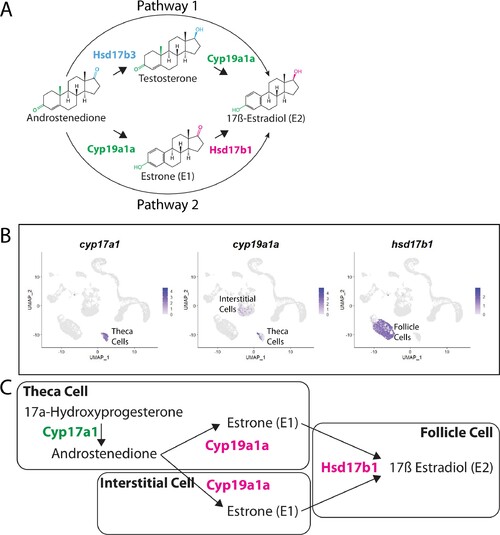
(A) Two possible pathways for E2 synthesis starting with androstenedione. Colors correspond to the region of the molecules being modified and to the enzyme that catalyzes the modification. (B) Gene expression uniform manifold approximation and projection (UMAP) plots of select genes. Top-left panel shows cells color-coded by computationally determined cell subtype. Cells expressing the indicated gene are colored purple, and the relative intensity indicates relative expression levels (intensity scale for each plot is on the right). (C) Proposed pathway for E2 synthesis in the zebrafish ovary, starting with the 17a-hydroxyprogesterone intermediate precursor, together with the cell types where each reaction occurs.
|
| Genes: | |
|---|---|
| Fish: | |
| Anatomical Terms: | |
| Stage: | Days 30-44 |
| Fish: | |
|---|---|
| Observed In: | |
| Stage: | Days 30-44 |