
FIGURE
Fig. 1 - supplement 2
- ID
- ZDB-FIG-220622-16
- Publication
- Liu et al., 2022 - Single-cell transcriptome reveals insights into the development and function of the zebrafish ovary
- Other Figures
- All Figure Page
- Back to All Figure Page
Fig. 1 - supplement 2
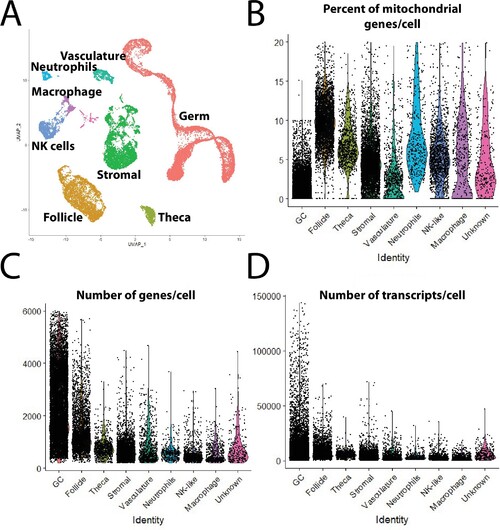
(A) Single-cell uniform manifold approximation and projection (UMAP) plot of 40-day-old zebrafish ovary with combined clusters based on major cell types. (B–D) Violin plot of percent of mitochondria genes (B), number of genes per cell (C), and number of transcripts per cell (D), in each major cell type in the final dataset.<
|
Expression Data
Expression Detail
Antibody Labeling
Phenotype Data
Phenotype Detail
Acknowledgments
This image is the copyrighted work of the attributed author or publisher, and
ZFIN has permission only to display this image to its users.
Additional permissions should be obtained from the applicable author or publisher of the image.
Full text @ Elife