
Fig. 1 - supplement 1
- ID
- ZDB-FIG-220622-15
- Publication
- Liu et al., 2022 - Single-cell transcriptome reveals insights into the development and function of the zebrafish ovary
- Other Figures
- All Figure Page
- Back to All Figure Page
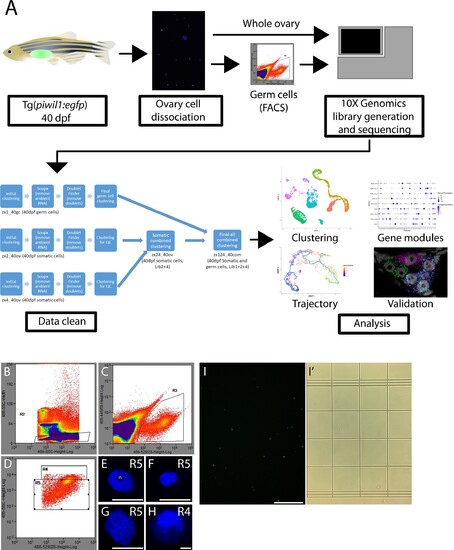
(A) Experimental pipeline for the production of the single-cell RNA-seq library. Briefly, 40-day post-fertilization (dpf) ovaries were isolated from Tg(piwil1:egfp) zebrafish and dissociated to single cells using two dissociation methods. The whole ovary dissociation method favored dissociation of somatic cells but led to loss of germ cells. A less stringent method was used to dissociate germ cells from somatic cells, followed by purification of germ cells by fluorescent-activated cell sorting (FACS). (B–D) FACS pseudocolor scatter plots with gating overlays. (B) The R2 gate selected for GFP+ single cells based on GFP fluorescence intensity (X-axis) and side scatter to measure cell size (Y-axis). (C) The R3 gate selected for GFP signal (X-axis) relative to cell autofluorescence (Y-axis). The R4 and R5 gates selected for cell size (Y-axis) and GFP signal (X-axis). The R5 gate contained smaller cells that were likely premeiotic, meiotic and early-stage oocytes, while R4 gate selected for larger cells that were likely more advanced oocytes. (E–H) Representative images of DAPI-stained nuclei from cells obtained from either the R5 (E–G) or R4 gates. (E) The prominent single nucleolus (n) contained within this nucleus is indicative of a premeiotic germ cell. (F, G) The diffuse chromatin in these nuclei is characteristic of premeiotic oocyte progenitor cells. (H) The presence of condensed and synapse chromosomes is characteristic of cells that have entered meiosis. Note that the nucleus in (H) is 30 µm in diameter while those in (E, F) are between 7 and 10 µm in diameter. Scale bars 10 µm. (I, I’). Fluorescence (I) or bright-field (I’) micrographs of GFP+ cells obtained from gate 5. Scale bars, (E–H) 10 µm; (I, I’) 250 µm.<
|