
Fig. 1
- ID
- ZDB-FIG-220622-14
- Publication
- Liu et al., 2022 - Single-cell transcriptome reveals insights into the development and function of the zebrafish ovary
- Other Figures
- All Figure Page
- Back to All Figure Page
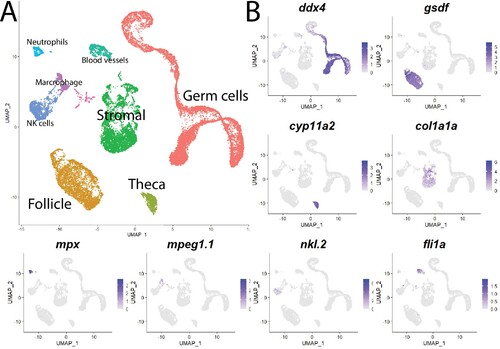
(A) Single-cell uniform manifold approximation and projection (UMAP) plot of the 40-day-old zebrafish ovary. Cells are color-coded by computationally determined cell clusters. (B) Gene expression plots of known cell-specific marker genes identify the major cell type (labeled in A) that each cluster corresponds to. Cells expressing the indicated gene are colored purple, and the relative intensity indicates relative expression levels (intensity scale for each plot is on the right).
|
| Genes: | |
|---|---|
| Fish: | |
| Anatomical Terms: | |
| Stage: | Days 30-44 |