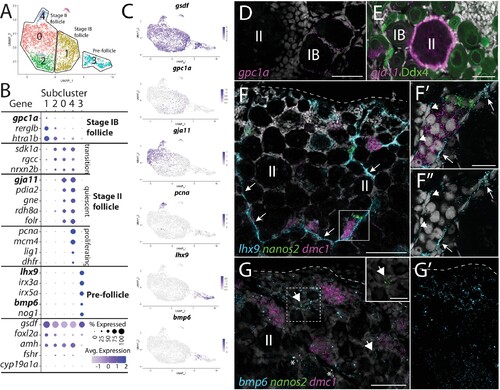
(A) Follicle cell subcluster uniform manifold approximation and projection (UMAP) plot, with cells color-coded by computationally determined cell subtypes. The three main subtypes are outlined. (B) Dot plot showing the relative expression of select genes in the follicle cell subclusters. Some genes, like gsdf, are expressed in all follicle cells, while others, such as lhx9, are only expressed in distinct subclusters. (C) Gene expression UMAP plots of select genes. Cells expressing the indicated gene are colored purple, and the relative intensity indicates relative expression levels (intensity scale for each plot is on the right). (D–G) Hybridization chain reaction RNA fluorescent in situ hybridization (HCR RNA-FISH) on whole-mount 40-day post-fertilization (dpf) ovaries reveals the location of cell subtypes. In all panels, DNA is gray. (D) gpc1a expression (pink) is detected in follicle cells surrounding stage IB oocytes, but not stage II oocytes. (E) gja11 expression (pink) is detected in follicle cells surrounding stage II oocytes, but not stage IB oocytes. Ddx4 indirect immunofluorescence (green) labels all germ cells. (F) Triple HCR RNA-FISH shows lhx9-expressing cells (blue) form tracts on the surface of the ovary (arrows) that colocalize with nanos2 (green) and dmc1 (pink)-expressing germline stem cells and early meiotic cells, respectively. Lateral edge of the ovary is indicated with a dashed line. (F’, F”) Higher-magnification views of regions boxed in (F) showing that lhx9+ cells (arrows) surround the germ cells. (G) Triple HCR RNA-FISH shows bmp6-expressing cells (blue) are concentrated near the lateral edge of the ovary, a region that contains nanos2 (green) and dmc1 (pink)-expressing germline stem cells (arrows) and early meiotic cells, respectively (inset in G shows nanos2 and DNA only for dashed boxed region). Asterisks identify autoflorescent red blood cells. (G’) bmp6 channel only. Scale bars in (D, E, G) for (G, G’) 50 µm; (F) 100 µm; (F’) (for F’ and F”) and (G, inset), 20 µm. IB, stage IB oocyte; II, stage II oocyte.