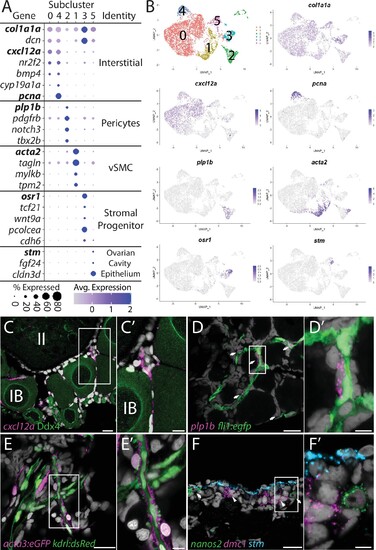
(A) Dot plot showing the relative expression of select genes in the stromal cell subclusters. Some genes, like col1a1a, are expressed in all stromal cells, while others, such as stm, are only expressed in a specific subcluster. Uniform manifold approximation and projection (UMAP) plots of genes in bold are shown in (B). Gene expression UMAP plots of select genes. Top-left panel shows cells color-coded by computationally determined cell subtype. Cells expressing the indicated gene are colored purple, and the relative intensity indicates relative expression levels (intensity scale for each plot is on the right). (C–G) Hybridization chain reaction RNA fluorescent in situ hybridization (HCR RNA-FISH) on whole-mount 40-day post-fertilization (dpf) ovaries reveals the location of cell subtypes. In all panels, DNA is gray. (C) cxcl12a-expressing interstitial cells localize around early-stage oocytes (≤stage IB), but not around stage II oocytes. Ddx4 indirect immunofluorescence (green) labels all germ cells. (C’) Higher magnification of the region boxed in (C). (D) plp1b- expression pericytes colocalize with fli1:egfp-expressing blood vessels (green). (D’) Higher magnification of region boxed in (D). (E). acta3:egfp expression vascular smooth muscle cells (red) surround kdrl:dsRed expression blood vessels (green). (E’) Higher magnification of the region boxed in (E). (F) stm (blue)-expressing cells localize to the lateral margin of the ovary and colocalize with nanos2 (green) and dmc1 (pink) germline stem cells and early meiotic cells, respectively. (F’) Higher magnification of the region boxed in (F). Scale bar in (C–E) 20 µm; (C’) 10 µm, (D’, E’, F’) 5 µm. IB, stage IB oocyte; II, stage II oocyte.