
Fig. 7
- ID
- ZDB-FIG-220520-44
- Publication
- Whyte-Fagundes et al., 2022 - Panx1 channels promote both anti- and pro-seizure-like activities in the zebrafish via p2rx7 receptors and ATP signaling
- Other Figures
- All Figure Page
- Back to All Figure Page
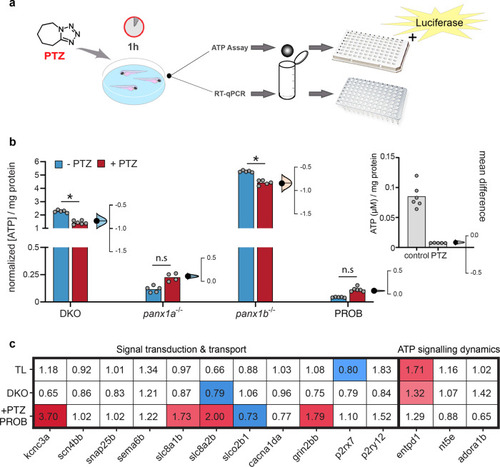
a Workflow diagram outlining the 1 h PTZ incubation for treated larvae. Larvae were collected for either RT-qPCR (n = 30 larvae/sample, N = 3 experimental replicates) or ATP assays (n = 50 larvae/sample, N = 5 experimental replicates), followed by homogenization prior to samples being plated in 96well format for measurement. Note that for ATP detection, luciferase was used. b Estimation plots of extracellular ATP concentrations (µM) concerning larval protein content (mg/ml) and normalized to the respective TL control. Extracellular ATP for TL controls is shown on the right (b), showing a significant decrease in ATP with PTZ treatment (P = < 1.0 × 10⁻⁴). Baseline ATP values are depicted by the blue bars, PTZ treatment is in red, and individual data points are displayed in gray to show data distribution. Difference of means is shown to the right of each group, with a 95% confidence interval to show effect size and significance. DKO (Δ mean = −0.84) and panx1b−/− (Δ mean = −0.84) show a significant decrease in ATP with PTZ treatment. Panx1a−/− (Δ mean = 0.1) and TL larvae with PROB (Δ mean = 0.07) show very low ATP concentrations; however, they do show a slight increase in ATP with PTZ treatment which is not significant. Panx1b−/− has the highest presence of ATP. (DKO: P = < 1.0 × 10⁻⁴; panx1a−/−: P = 0.98; panx1b−/−: P = < 1.0 × 10⁻⁴; PROB: P = 1.0; Tukey’s multiple comparisons test). c RT-qPCR of selected genes grouped into signal transduction and transport, or ATP signaling dynamic categories, showing significant up (red) or down (blue) regulation, with respect to non-treated controls, in response to PTZ treatment for TL, DKO and TLs treated with PROB. (N = 3 experimental replicates). *P < 0.0001. |
| Genes: | |
|---|---|
| Fish: | |
| Conditions: | |
| Anatomical Term: | |
| Stage: | Days 7-13 |
| Fish: | |
|---|---|
| Conditions: | |
| Observed In: | |
| Stage: | Days 7-13 |