
Fig. 8
- ID
- ZDB-FIG-220520-45
- Publication
- Whyte-Fagundes et al., 2022 - Panx1 channels promote both anti- and pro-seizure-like activities in the zebrafish via p2rx7 receptors and ATP signaling
- Other Figures
- All Figure Page
- Back to All Figure Page
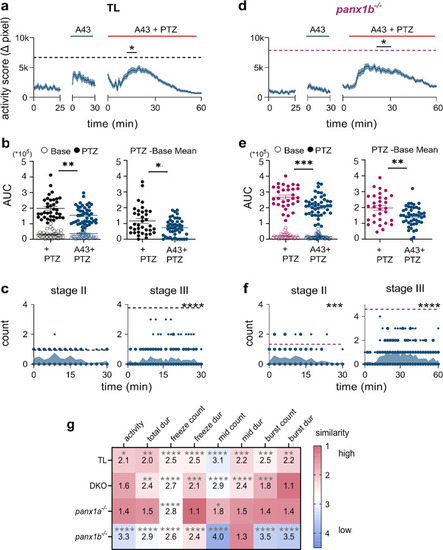
a 100 µM A-438079 (A43) treatment decreased hyperactivity in TL in the first 10 min of PTZ treatment (∆pixel ± s.e.m.; n = 46; P = 2.1 × 10⁻³). The dashed gray line indicates TL’s max average activity score treated with only PTZ (n = 36). b AUCs for TL’s baseline activity and A43 treatment did not differ (open points; P = 0.9). A43 treatment significantly reduced the effect of PTZ without (filled points; P = 2.4 × 10⁻³) and with (P = 4.5 × 10⁻²) extracted baseline activity. c Stage III count (count/2 min) was significantly reduced with A43 treatment in TL (n = 18; P = < 1.0 × 10⁻⁴). Dashed lines represent max average Stage II and Stage III counts for TL’s PTZ-only group. d A43 treatment decreased PTZ-induced hyperactivity in panx1b−/− (n = 46; P = 4.0 × 10⁻⁴). The dashed magenta line indicates panx1b−/−’s max average activity in the PTZ only group (n = 31). e A43 treatment significantly reduced the effect of PTZ in panx1b−/− without (filled points; P = 5.0 × 10⁻⁴) and with (P = 8.7 × 10⁻³) extracted baseline activity. f Stage II and III counts were significantly reduced with A43 treatment in panx1b−/− (n = 18; stage II: P = 1.0 × 10⁻⁴; stage III: P ≤ 1.0 × 10⁻⁴). Dashed lines represent max average Stage II and Stage III counts for panx1b−/−’s PTZ-only group. g SOM revealed changes to the PTZ phenotype in TL with A43 treatment (n = 46) for freezing and normal locomotor behaviors (P < 0.0001). A43 treatment resembled panx1a−/−‘s PTZ phenotype the most, and panx1b−/−‘s the least, as seen in normal (mid count P < 0.0001) and bursting behaviors (P < 0.0001). Smaller value and warmer color represent higher similarity. Statistical tests used: Two-way repeated measures ANOVA and Bonferroni multiple comparisons for(a, c, d & f); Mann–Whitney U test for (b and e). Fisher’s exact test for (g). N = number of larvae. *P < 0.05, **P < 0.01, ***P < 0.001, ****P < 0.0001. |
| Fish: | |
|---|---|
| Conditions: | |
| Observed In: | |
| Stage: | Days 7-13 |