
Fig. S1
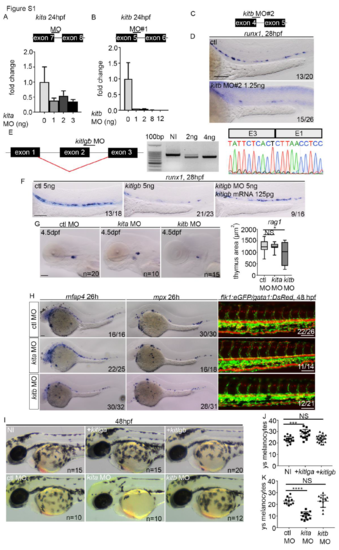
MO validation and knockdown of kita, kitb and kitlgb. (A, B) Schematic of splice blocking MO targeting intron/exon junctions in kita and kitb (schematics are not to scale), along with qPCR analysis of kita and kitb expression after MO injection at different concentrations. Data is mean±SD. cDNA was synthesised from total RNA extracted at 24hpf from a pool of 6-10 embryos. (C) Schematic of second splice blocking MO targeting intron/exon junctions in kitb. (D) ISH to examine runx1 (28hpf) expression. runx1 was reduced in a similar manner as in embryos injected with kitb MO#1. kitb MO#2 was only used here, all other data uses kitb MO#1 (herein referred to as kitb MO). (E) Validation of kitlgb MO that induces exon skipping (confirmed by cDNA synthesis at 24hpf from pools of 6-10 embryos, then sequencing PCR product using reverse primer). (F) kitlgb morphants have reduced runx1 (28hpf) expression, which is rescued by injecting full length mRNA for kitlgb. (G) rag1 expression following MO injection. (H) ISH to examine macrophages (mfap4 expression) and neutrophils (mpx expression). Flk1:eGFP/gata1:DsRed embryos were used to examine blood flow and endothelial cell formation. (I-K) Analysis of the number of pigments on the left side of the yolk sack region in either MO or mRNA injected embryos at 48hpf. NI, non-injected control. +kitlga/+kitlgb, kitlga/kitlgb full length mRNA injected embryos. All data represents mean±SD. Statistical analysis completed using ordinary one-way ANOVA with multiple comparisons. In A, p=0.0008. In D, p=0.0002. In E, p value is less than 0.0001. ****, p<0.0001. ***, p<0.001. *, p<0.05. NS, p>0.05. ys, yolk sack. All scale bars Scale bars are 100μm, except G, where scale bar is 50μm. |
| Genes: | |
|---|---|
| Fish: | |
| Knockdown Reagents: | |
| Anatomical Terms: | |
| Stage Range: | Prim-5 to Day 4 |
| Fish: | |
|---|---|
| Knockdown Reagents: | |
| Observed In: | |
| Stage Range: | Prim-5 to Day 4 |