
Fig. S5
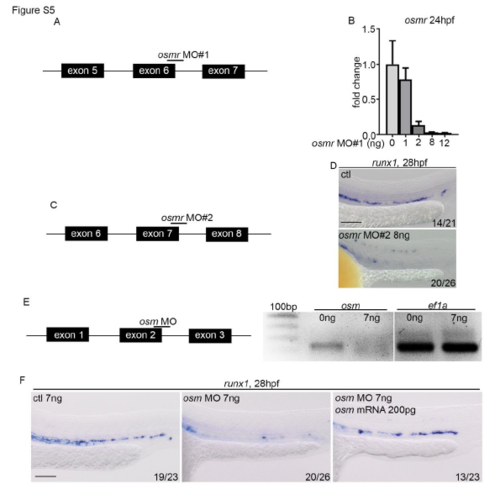
Validation of MOs for osmr and osm. (A) Schematic of splice blocking MO targeting exon/intron junction in osmr. Schematic is not to scale. (B) qPCR analysis of osmr expression after osmr MO injection at different concentrations. Data is mean±SD. cDNA was synthesised from total RNA extracted from 24hpf embryos. (C) Schematic of second splice blocking MO targeting intron/exon junctions in osmr. (D) ISH to examine runx1 (28hpf) expression. runx1 was reduced in a similar manner as in embryos injected with osmr MO#1. osmr MO#2 was only used here, all other data uses osmr MO#1 (herein referred to as osmr MO). (E) Validation of osm MO. (F) osm morphants have reduced runx1 (28hpf) expression, which is rescued by injecting full length mRNA for osm. All scale bars are 100μm. |
| Gene: | |
|---|---|
| Fish: | |
| Knockdown Reagent: | |
| Anatomical Term: | |
| Stage: | Prim-5 |
| Fish: | |
|---|---|
| Knockdown Reagent: | |
| Observed In: | |
| Stage: | Prim-5 |