
FIGURE
Fig. S4
Fig. S4
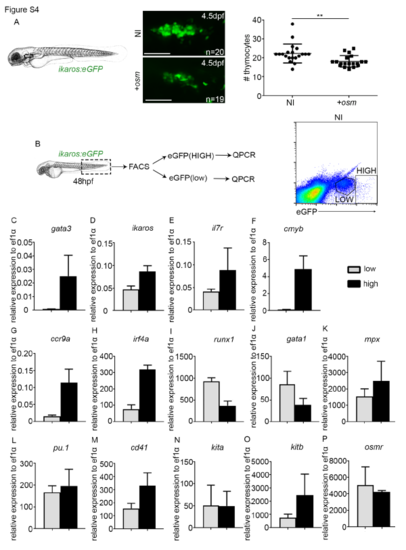
Characterisation of ikaroshigh and ikaroslow population. (A) Thymus imaging in ikaros:eGFP 4.5dpf embryos. P=0.0031. Scale, 50μm. NI, non-injected control. +osm, osm full length mRNA injected embryos. (B) FACS sorting of ikaros:eGFPlow and ikaros:eGFPhigh cells at 48hpf from non-injected embryos. (C-P) qPCR analysis of gene expression in the low and high population. Data represented is mean±SD from biological triplicates, except in runx1, gata1 and osmr ikaros:eGFPhigh where data is biological duplicates. Statistical analysis was completed using an unpaired, two-tailed Student's t-test. ** p<0.01. |
Expression Data
Expression Detail
Antibody Labeling
Phenotype Data
Phenotype Detail
Acknowledgments
This image is the copyrighted work of the attributed author or publisher, and
ZFIN has permission only to display this image to its users.
Additional permissions should be obtained from the applicable author or publisher of the image.
Full text @ Stem Cell Reports