
Fig. 3
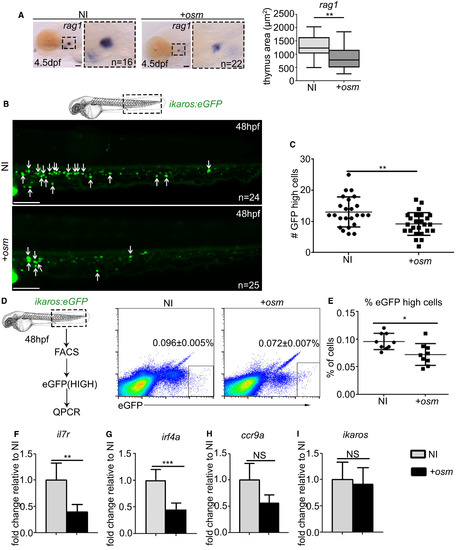
osm Inhibits Lymphocyte Priming and Differentiation by Repressing Lymphoid Gene Expression (A) ISH at 4.5 dpf of rag1 thymus staining with quantification of thymus area, where p = 0.0087. Scale, 50 μm. (B) Live imaging of CHT region in ikaros:eGFP embryos at 48 hpf. Each arrow indicates a single ikaros:eGFPhigh cell. Scale, 100 μm. (C) Quantification of the number of ikaros:eGFPhigh cells at 48 hpf, p = 0.0028. (D) FACS sorting and analysis of ikaros:eGFPhigh cells at 48 hpf (p = 0.0112). Values indicated on FACS plots are mean ± SEM, graphs are means ± SD. (E) Quantification of ikaros:eGFPhigh cells. (F–I) qPCR analysis of il7r (F) (p = 0.0017), irf4a (G) (p = 0.0001), ccr9a (H) (p = 0.1265), and ikaros (I) (p = 0.8030) expression in ikaros:eGFPhigh cells FACS sorted at 48 hpf. qPCR data shown are the mean ± SEM of three data points, calculated from three independent experiments. Each separate experiment was conducted in biological triplicates, then averaged to give a single value. NI, non-injected control. +osm, osm full-length mRNA-injected embryos. Statistical analysis was completed using an unpaired, two-tailed Student's t test. ∗∗∗p < 0.001; ∗∗p < 0.01; ∗p < 0.05; NS, p > 0.05. |
| Genes: | |
|---|---|
| Fish: | |
| Anatomical Terms: | |
| Stage Range: | Long-pec to Day 4 |