
- Title
-
A nop56 Zebrafish Loss-of-Function Model Exhibits a Severe Neurodegenerative Phenotype
- Authors
- Quelle-Regaldie, A., Folgueira, M., Yáñez, J., Sobrido-Cameán, D., Alba-González, A., Barreiro-Iglesias, A., Sobrido, M.J., Sánchez, L.
- Source
- Full text @ Biomedicines

(A): Phenotype of wild-type, nop56+/− and nop56−/− between 24 and 120 hpf. At 24 hpf, nop56−/− show statistically significant reduced head size, smaller eyes and smaller. At 48 hpf, statistically significant reduced body length can be also observed in nop56−/− embryos, as well as swollen yolk (in 100% of nop56−/− embryos) and curved body shape in (40% of the nop56−/− embryos). At 72 hpf, in addition to the previous features, there is cardiac edema in 77% of the embryos. In addition, at 96 and 120 hpf, there is total absence of swimming bladder in all nop56−/− embryos, curved body shape (in 50% of nop56−/− larvae) and a cardiac edema (in 88% of the nop56−/− larvae at 96 hpf and 100% at 120 hpf). For these parameters, no statistically significant differences were observed between wild type and nop56+/−. Statistically significant data in the graphs are indicated with a *. Scale bar: 1000 μm. (B) Kaplan–Meier survival graph for wild-type (n = 43), nop56+/− (n = 75) and nop56−/− (n = 44) zebrafish, revealing significantly different survivals for the nop56−/− embryos p < 0.0001. |
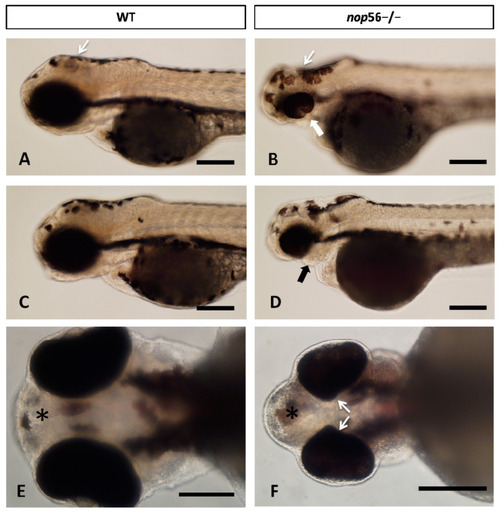
(A–D) Lateral views of WT and nop56−/− larvae (3.5 dpf), showing coloboma (white thick arrow in (B)) and jaw malformation (black arrow in (D)) in the homozygous fish. Note also differences in the midbrain and cerebellum (thin white arrows). (E,F) Ventral view of WT and nop56−/− fish showing malformation of the eye (arrows) and forebrain (asterisk). Scale bar: 125 μm. PHENOTYPE:
|
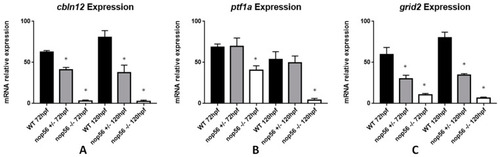
Graphic representation of expression analysis by RT-qPCR. (A) Cbln12 expression is significantly reduced in nop56+/− and nop56−/− embryos between at 72 and 120 hpf in comparison with wild-type embryos (p-value < 0.0001). (B) Ptf1a expression is significantly reduced in nop56−/− embryos at 72 and 120 hpf (p-value < 0.0001.) (C) Grid2 expression is significantly reduced in nop56+/− and nop56−/− embryos between at 72 and 120 hpf in comparison with wild-type embryos (p-value < 0.0001). Statistically significant data in the graphs is indicated with a *. EXPRESSION / LABELING:
PHENOTYPE:
|

(A,B) Lateral views of WT (A) and nop56−/− (B) 3.5 dpf larvae immunostained against α-tubulin (magenta) showing abnormalities in the jaw (thick arrow) and brain, specially in the midbrain (asterisk) and cerebellum (thin arrow). (C,D) Lateral views of WT (C) and nop56−/− (D) fish immunostained against SV2 (green) showing different distribution in the brain, especially in the midbrain (asterisk) and cerebellum (arrow). (E,F) Ventral views of WT (E) and nop56−/− (F) showing lack of midline fibers and bundles in the homozygous fish (arrow in (F)), compared to WT (arrow in (E)). (G–F) Lateral views of WT (G) and nop56−/− (H) brain showing smaller midbrain in the homozygous fish (asterisk in (H)) and absence of labelling in cerebellum (arrow in (H)), compared to WT (asterisk and arrows in (G)). All images are projections from confocal z-stacks. Scale bars: 125 μm. EXPRESSION / LABELING:
PHENOTYPE:
|

Zebrin II immunofluorescence in 4 dpf zebrafish larvae revealed a complete lack of cerebellar Purkinje cells in nop56−/−. Dorsal views. Anterior to the top. Scale bar: 150 μm. |

(A,B) Lateral views of WT (A) and nop56−/− (B) 3.5 dpf larvae showing malformations in the neuromuscular junctions and the innervation of the trunk myomeres. All images are projections from confocal z-stacks. (A,B) Alpha-tubulin staining (magenta) showing alterations in the distribution of fibers and bundles in the trunk (thin arrows). White thick arrows in (A,B) point to posterior lateral line nerve. (C,D) SV2 (green) staining showing alterations in neuromuscular junction (arrows) and myosepta in nop56−/− compared to wild type. Asterisk in (B,D) marks the spinal cord. Scale bar: 150 μm. EXPRESSION / LABELING:
PHENOTYPE:
|

5-HT immunofluorescence in 4 dpf zebrafish larvae revealed significant reduction in the number of 5-HT-ir spinal cord neurons in nop56−/− animals. Scale bar: 150 μm. Statistically significant data in the graphs are indicated with ****. |
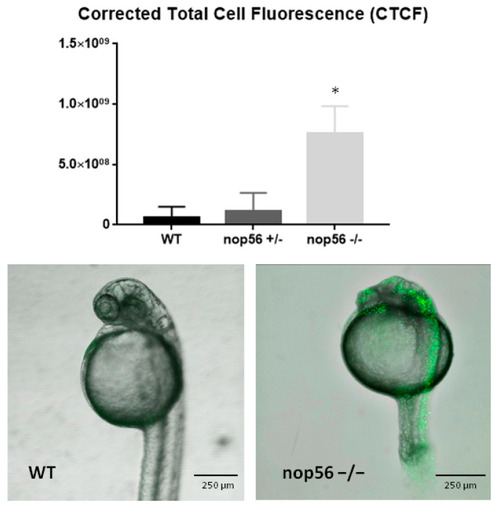
Apoptosis assay in wild type, nop56+/− and nop56−/−. Fluorescence highlights apoptotic cells. nop56−/− have a high increase in apoptosis mainly in CNS (p-value < 0.0001). Statistically significant data in the graphs are indicated with a *. PHENOTYPE:
|

Graphic representation of analysis of mRNA expression by RT-qPCR. (A) p21 expression is significantly higher in nop56−/− larvae between 72 and 120 hpf (p-value < 0.0001.) (B) p53 expression is significantly higher in nop56−/− larvae between 72 and 120 hpf (p-value < 0.0001.) (C) Microinjection of p53 morpholino restored the expression in nop56−/− embryos to levels similar to wild type but not the malformations (data not shown). Statistically significant data in the graphs are indicated with a *. EXPRESSION / LABELING:
PHENOTYPE:
|
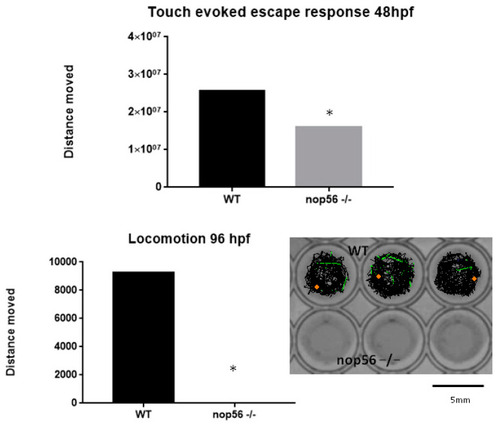
Touch-evoked escape was reduced at 48 hpf in nop56−/− embryos and locomotion was absent in nop56−/− larvae at 96 hpf (p-value < 0.0001). Statistically significant data in the graphs are indicated with a *. |

Graphic representation of expression analysis by RT-qPCR. (A) Zpld1a expression is significantly reduced in nop56−/− larvae between 72 and 120 hpf (p-value < 0.0001). (B) Zpld1a expression is significantly reduced in nop56−/− larvae between 72 and 120 hpf (p-value < 0.0001) and in nop56+/− at 120 hpf. Statistically significant data in the graphs are indicated with a *. EXPRESSION / LABELING:
PHENOTYPE:
|
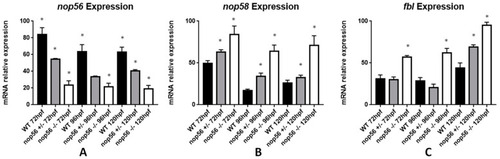
Graphic representation of mRNA expression analysis by RT-qPCR. (A) nop56 expression is significantly different in wild-type, nop56+/− and nop56−/− larvae between 72 and 120 hpf (p-value < 0.0001). (B) nop58 expression is significantly higher in nop56−/− and nop56+/−larvae between 72 and 120 hpf (p-value < 0.0001.) (C) fbl expression is significantly higher in nop56−/− larvae between 72 and 120 hpf (p-value < 0.0001) and in nop56+/− at 120 hpf respect to wild-type larvae (p-value < 0.0001). Statistically significant data in the graphs are indicated with a *. EXPRESSION / LABELING:
PHENOTYPE:
|
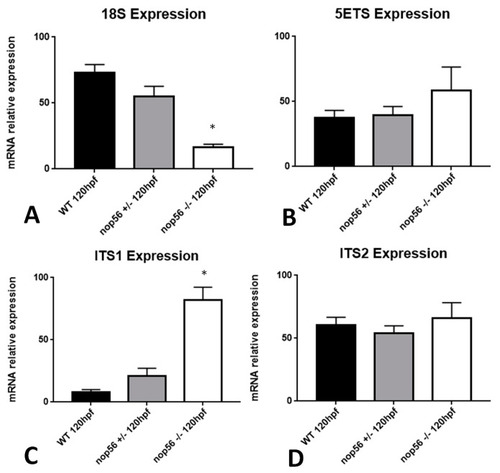
Graphic representation of expression analysis by RT-qPCR. (A) 18S rRNA expression is significantly reduced in nop56−/− larvae at 120 hpf (p-value < 0.0001). (B) 5ETS expression does not differ between wild type, nop56−/− and nop56+/− embryos at 120 hpf (C) ITS1 expression is significantly higher in nop56−/− larvae between at 120 hpf (p-value < 0.0001). (D) ITS2 expression does not differ between wild type, nop56−/− and nop56+/− larvae at 120 hpf. Statistically significant data in the graphs are indicated with a *. PHENOTYPE:
|

Graphic representation of mRNA expression analysis by RT-qPCR. (A) c9of72 expression is significantly reduced in nop56−/− embryos between 72 and 120 hpf (p-value < 0.001) and in nop56+/− at 120 hpf (p-value=0.0015). (B) tardbp expression is significantly reduced in nop56−/− embryos between 72 and 120 hpf (p-value < 0.001). (C) fus expression is significantly reduced in nop56−/− embryos between 72 and 120 hpf (p-value < 0.0001) and in nop56+/− embryos at 120 hpf (p-value < 0.0001). Statistically significant data in the graphs are indicated with a *. EXPRESSION / LABELING:
PHENOTYPE:
|