FIGURE SUMMARY
Title

Ablation of Mto1 in zebrafish exhibited hypertrophic cardiomyopathy manifested by mitochondrion RNA maturation deficiency

Authors
Zhang, Q., He, X., Yao, S., Lin, T., Zhang, L., Chen, D., Chen, C., Yang, Q., Li, F., Zhu, Y.M., Guan, M.X.
Source
Full text @ Nucleic Acids Res.

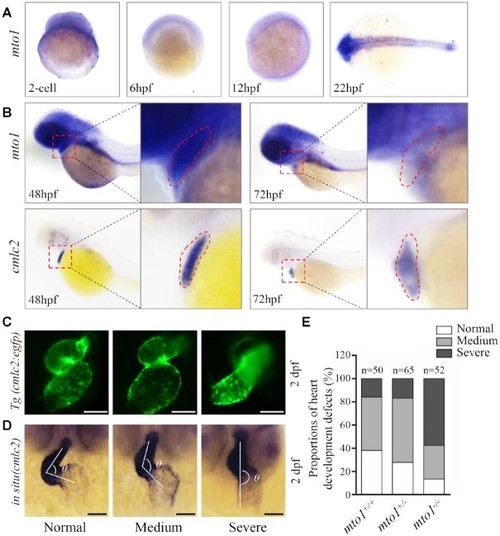
Heart development defects in zebrafish. (A) Whole-mount in situ hybridization (WISH) analysis of mto1 expression on wild type larval zebrafish at various ages (2-cell to 24 hpf). (B) WISH analysis of mto1 on wild type larval zebrafish at 48 hpf and 72 hpf. cmlc2 marker was used to indicate the place of heart. Insets show higher magnifications of heart. (C) Tg (cmlc2:egfp) embryos at 2 dpf shows the heart-restricted GFP expression in both chambers. Scale bars: 50 μm. (D) WISH against cmlc2. According to the looping state, measured by the angles between ventricle and atrium, hearts were divided into normal (α < 90°), medium (90° < α < 180°), and severe (α > 180°). Scale bars: 50 μm. (E) The proportions of each phenotypes in the embryos in mutant and WT zebrafish.

EXPRESSION / LABELING:
Genes:
Fish:
Anatomical Terms:
Stage Range: 2-cell to Protruding-mouth
PHENOTYPE:
Fish:
Observed In:
Stage: Long-pec

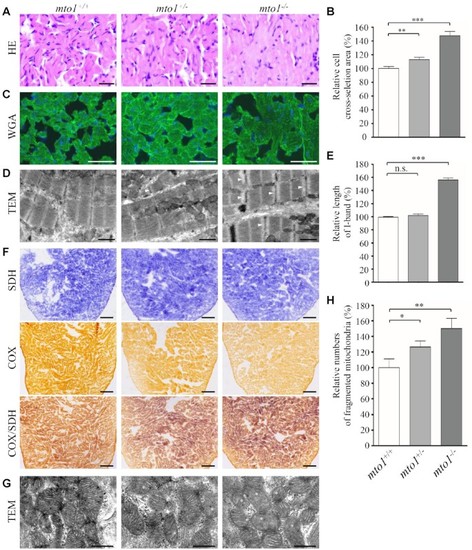
Hypertrophic cardiomyopathy and mitochondrial defects in the zebrafish. (A) Hematoxylin and eosin stained (H&E) histological sections of hearts from mto1−/−, mto1+/− and mto1+/+ zebrafish at the age of 6 months. Scale bars: 20 μm. (B) The relative cross-sectional areas of cardiomyocytes in the mto1+/+ (n = 104), mto1+/− (n = 112), mto1−/− (n = 92) zebrafishes, staining with H&E. (C) The cardiomyocytes from mutant and WT zebrafishes were visualized via WGA staining. Scale bars: 20 μm. (D) Ventricular heart muscle sections of transmission electron microscopy in the mutant and WT zebrafish. Ultrathin sections were visualized with 15 000× magnifications. Widened I-band in the sarcomere units were indicated by white arrowhead. Scale bars: 1 μm. (E) Quantification of the I-band lengthes of mto1+/+ (n = 28), mto1+/− (n = 18) and mto1−/− (n = 29) zebrafish. The values for the mutants were expressed as percentages of the mean values for the WT. (F) Assessment of mitochondrial functions in cardiomyocytes by enzyme histochemistry (EHC) staining for cytochrome c oxidase (COX) and succinate dehydrogenase (SDH) in the frozen-sections of ventricles in the mto1−/−, mto1+/− and mto1+/+ zebrafish at six-month old. Scale bars: 50 μm. (G) Mitochondrial networks from cardiomyocytes of transmission electron microscopy. Ultrathin sections were visualized with 30 000× magnifications. Fragmented mitochondria are indicated by asterisks. Scale bars: 0.5 μm. (H) Quantifications of fragmented mitochondria numbers of cardiomyocytes from the mto1−/−, mto1+/− and mto1+/+ zebrafish. The error bars indicate standard deviations of the means. P indicates the significance, according to Student's t test, of the difference between mto1+/− or mto1−/− and WT values, denoted by asterisks (*P< 0.05, **P< 0.01, ***P< 0.001), and non-significant differences by n.s.

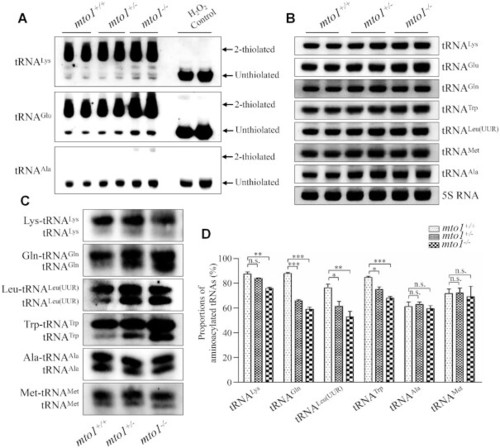
Northern blotting analysis of mitochondrial tRNA. (A) APM gel electrophoresis. Five μg total RNAs of mutant and WT zebrafish were separated by polyacrylamide gel electrophoresis that contains 0.05 mg/ml APM, electroblotted onto a positively charged membrane, and hybridized with DIG-labeled oligonucleotide probes specific for tRNALys, tRNAGlu and tRNAAla, respectively. H2O2-treated tRNA was used as a control of complete oxidation of thiolation, eliminating the mobility shift. The retarded bands of 2-thiolated tRNAs and non-retarded bands of tRNA without thiolation are marked by arrows. (B) Northern blot analysis of tRNA under a denaturing condition. Five micrograms of total RNAs of mutant and WT zebrafish were electrophoresed through a denaturing polyacrylamide gel, electroblotted and hybridized with the DIG-labeled oligonucleotide probes specific for tRNALys, tRNAGlu, tRNAGln, tRNATrp, tRNALeu(UUR), tRNAMet, tRNAAla, and 5S rRNA as a loading control, respectively. (C) Five micrograms of total RNAs from mutant and WT zebrafish under acid conditions were electrophoresed at 4°C through an acid (pH 5.2) 10% polyacrylamide with 8 M urea gel, electroblotted, and hybridized with a DIG-labeled oligonucleotide probes specific for the tRNALys, tRNAGln, tRNALeu(UUR), tRNATrp, tRNAAla and tRNAMet, respectively. (D) Quantification of aminoacylated proportions of tRNAs in mutant and WT zebrafish. The calculations were based on three independent experiments. Graph details and symbols are explained in the legend to the Figure 2.

Analysis of mitochondrial tRNA conformation. (A) Northern blot analysis of tRNAs under native condition. Five micrograms of total RNAs from mutant and WT zebrafish were electrophoresed through a native polyacrylamide gel, electroblotted and hybridized with the DIG-labeled oligonucleotide probes as tRNAGln, tRNATrp, tRNALeu(UUR), tRNALys and tRNAAla, respectively. (B) S1 digestion patterns of tRNAGln, tRNATrp, tRNALeu(UUR), tRNALys and tRNAAla. Two micrograms of RNAs from mto1−/− and WT zebrafish were used for the S1 cleavage reaction at various lengths (from 0 to 120 min). Cleavage products of tRNAs were resolved in 10% denaturating PAGE gels with 8 M urea, electroblotted and hybridized with 3′ end DIG-labeled oligonucleotide probes specific for tRNAGln, tRNATrp, tRNALeu(UUR), tRNALys and tRNAAla, respectively. Arrows denoted the 30–40 nt regions showing 3′ tRNA half.

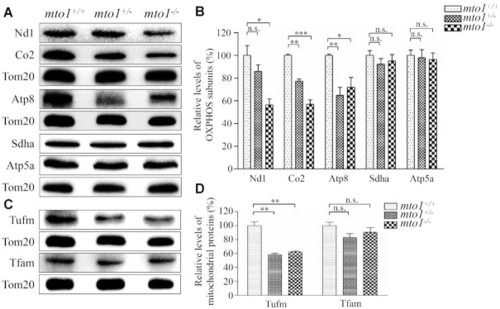
Western blotting analysis of mitochondrial proteins. (A, C) Twenty micrograms of total proteins from mutant and WT zebrafish were electrophoresed through a denaturing polyacrylamide gel, electroblotted and hybridized with antibodies for 5 subunits of OXPHOS (mitochondrion-encoding Nd1, Co2 and Atp8 and nucleus-encoding Sdha and Atp5a), Tufm, Tfam and Tom20 as a loading control. Quantification of levels of OXPHOS subunits (B) and other mitochondrial proteins (D). Average contents of Nd1, Co2, Atp8, Atp5a, Sdha, Tufm and Tfam were normalized to the average content of Tom20 in mutant and WT zebrafish. The values for the mutant zebrafish are expressed as percentages of the average values for the WT zebrafish. The calculations were based on three independent determinations. Graph details and symbols are explained in the legend to Figure 2.

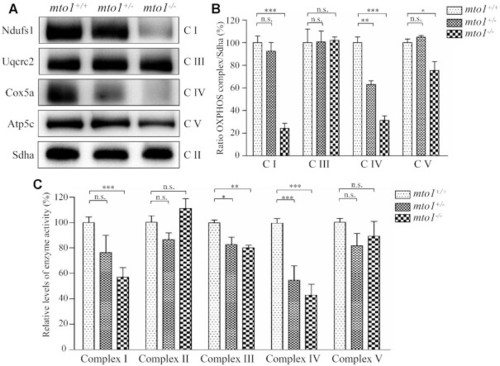
The instability of OXPHOS complexes. (A) The steady-state levels of five OXPHOS complexes by Blue-Native gel electrophoresis. Fifteen micrograms of mitochondrial proteins from mutant and WT zebrafish were electrophoresed through a Blue-Native gel, electroblotted and hybridized with antibodies for Ndufs1, Uqcrc2, Cox5a, Atp5c (subunits of complex I, III, IV and V, respectively) as well as Sdha (subunit of complex II) as a loading control. (B) Quantification of levels of complexes I, III, IV and V in mutant and WT zebrafish. (C) The activities of OXPHOS complexes were investigated by enzymatic assays on complexes I, II, III, IV and V in mitochondria isolated from mutant and WT zebrafish. The calculations were based on three independent determinations. Graph details and symbols are explained in the legend to Figure 2.

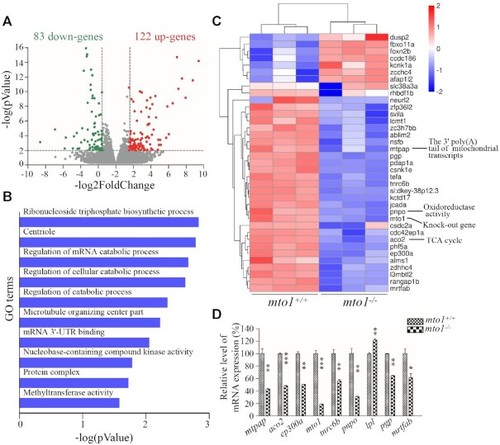
Transcriptome analysis of zebrafish hearts. (A) Volcano plots of total RNA sequencing revealed 205 differentially expressed genes (122 up-regulated (red dots) and 83 down-regulated (green dots)) between WT and mto1−/− zebrafish hearts (n = 5) at the age of 4–6 months. (B) Gene ontology (GO) enrichment analysis of mto1 target genes. The color of the bars indicates the P-value for the gene enrichment in our analysis. (C) Hierarchical clustering of the top 37 differentially expressed genes are presented as a heat map. Higher and lower expressed genes were marked in red and blue, respectively. (D) PCR validation of selected differentially regulated genes. Graph details and symbols are explained in the legend to Figure 2.

EXPRESSION / LABELING:
Genes:
Fish:
Anatomical Term:
Stage: Adult
PHENOTYPE:
Fish:
Observed In:
Stage: Adult

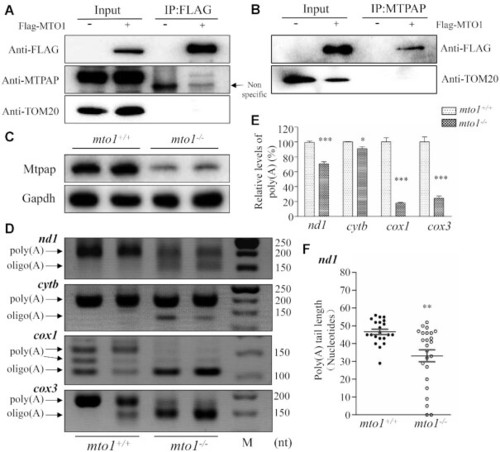
The synergic effects between Mto1 and Mtpap on the polyadenylation of mRNAs. (A, B) Immunoprecipitation analysis of MTO1 with MTPAP. HEK 293T cells transiently expressing with or without MTO1-FLAG were solubilized with a lysis buffer and lysate proteins were immuno-precipitated with immunocapture buffer (left) (input) and FLAG-antibody (right) (IP), respectively. Immunoprecipitates were analyzed by SDS-PAGE and Western blotting using anti-FLAG, anti-MTPAP and TOM20 antibodies, respectively. (C) Western blot analysis. Twenty micrograms of total proteins from mto1−/− and WT zebrafish were electrophoresed through a denaturing polyacrylamide gel, electroblotted and hybridized with antibodies for Mtpap and Gapdh as a loading control. (D) Polyadenylation profiles of mitochondrial mRNAs upon mto1−/− and WT zebrafish hearts. The 3′ termini of nd1, cytb, cox1 and cox3 mRNAs were assessed by RT-PCR amplifications from polyadenylated and oligoadenylated RNAs of mto1−/− and WT zebrafish hearts and 3% agarose gel electrophoresis. Arrows indicated the positions of PCR products from the polyadenylated and oligoadenylated RNAs, respectively. (E) Quantification of poly(A) proportions of nd1, cytb, cox1 and cox3 transcripts in the WT and mto1−/− zebrafish. (F) Poly(A) tail lengths from individually sequenced clones after 3’ end RACE analysis of nd1 transcripts in the mto1−/− and WT zebrafish hearts. Graph details and symbols are explained in the legend to Figure 2.

Acknowledgments
This image is the copyrighted work of the attributed author or publisher, and ZFIN has permission only to display this image to its users. Additional permissions should be obtained from the applicable author or publisher of the image. Full text @ Nucleic Acids Res.