|
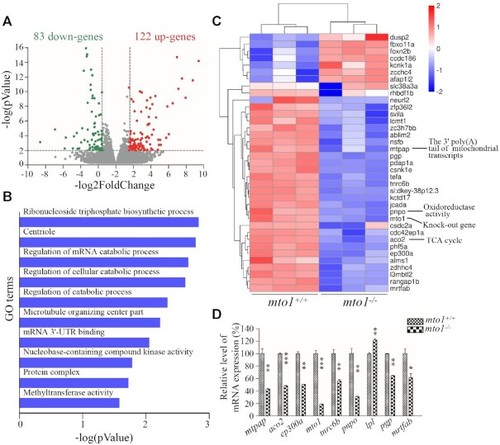
Transcriptome analysis of zebrafish hearts. (A) Volcano plots of total RNA sequencing revealed 205 differentially expressed genes (122 up-regulated (red dots) and 83 down-regulated (green dots)) between WT and mto1−/− zebrafish hearts (n = 5) at the age of 4–6 months. (B) Gene ontology (GO) enrichment analysis of mto1 target genes. The color of the bars indicates the P-value for the gene enrichment in our analysis. (C) Hierarchical clustering of the top 37 differentially expressed genes are presented as a heat map. Higher and lower expressed genes were marked in red and blue, respectively. (D) PCR validation of selected differentially regulated genes. Graph details and symbols are explained in the legend to Figure 2.
|