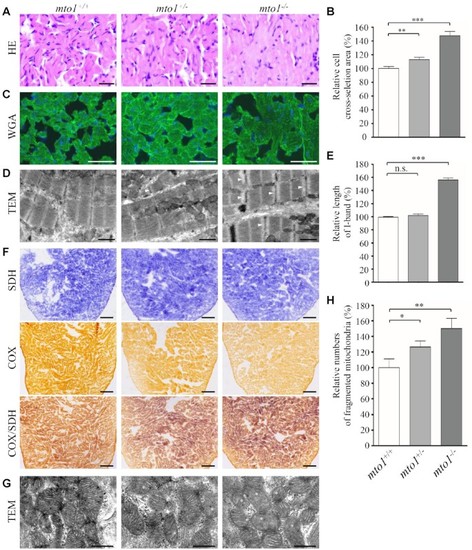
Hypertrophic cardiomyopathy and mitochondrial defects in the zebrafish. (A) Hematoxylin and eosin stained (H&E) histological sections of hearts from mto1−/−, mto1+/− and mto1+/+ zebrafish at the age of 6 months. Scale bars: 20 μm. (B) The relative cross-sectional areas of cardiomyocytes in the mto1+/+ (n = 104), mto1+/− (n = 112), mto1−/− (n = 92) zebrafishes, staining with H&E. (C) The cardiomyocytes from mutant and WT zebrafishes were visualized via WGA staining. Scale bars: 20 μm. (D) Ventricular heart muscle sections of transmission electron microscopy in the mutant and WT zebrafish. Ultrathin sections were visualized with 15 000× magnifications. Widened I-band in the sarcomere units were indicated by white arrowhead. Scale bars: 1 μm. (E) Quantification of the I-band lengthes of mto1+/+ (n = 28), mto1+/− (n = 18) and mto1−/− (n = 29) zebrafish. The values for the mutants were expressed as percentages of the mean values for the WT. (F) Assessment of mitochondrial functions in cardiomyocytes by enzyme histochemistry (EHC) staining for cytochrome c oxidase (COX) and succinate dehydrogenase (SDH) in the frozen-sections of ventricles in the mto1−/−, mto1+/− and mto1+/+ zebrafish at six-month old. Scale bars: 50 μm. (G) Mitochondrial networks from cardiomyocytes of transmission electron microscopy. Ultrathin sections were visualized with 30 000× magnifications. Fragmented mitochondria are indicated by asterisks. Scale bars: 0.5 μm. (H) Quantifications of fragmented mitochondria numbers of cardiomyocytes from the mto1−/−, mto1+/− and mto1+/+ zebrafish. The error bars indicate standard deviations of the means. P indicates the significance, according to Student's t test, of the difference between mto1+/− or mto1−/− and WT values, denoted by asterisks (*P< 0.05, **P< 0.01, ***P< 0.001), and non-significant differences by n.s.
|
