FIGURE SUMMARY
Title

Pancreatic and intestinal endocrine cells in zebrafish share common transcriptomic signatures and regulatory programmes

Authors
Lavergne, A., Tarifeño-Saldivia, E., Pirson, J., Reuter, A.S., Flasse, L., Manfroid, I., Voz, M.L., Peers, B.
Source
Full text @ BMC Biol.

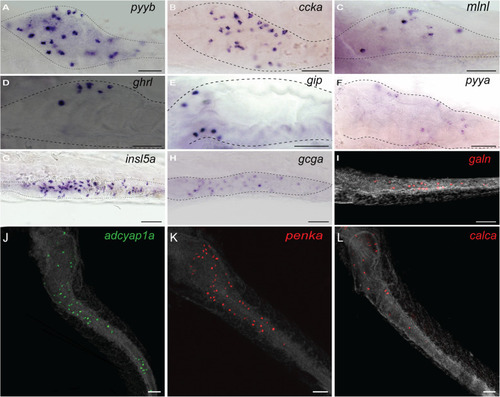
Expression of different enteroendocrine hormones in the zebrafish gut. Whole-mount in situ hybridization (WISH) obtained with different hormonal probes at 3 dpf (ah, k) or 4 dpf (i, k). Ventral views of embryos with anterior on the left. The dotted lines represent the location of the gut. The probes used are as follows: adcyap1a, adenylate cyclase-activating polypeptide 1a; ccka, cholecystokinin a; gcga, Glucagon a; pyya/b, Peptide YYa/b; ghrl, Ghrelin; gip, glucose-dependent insulinotropic polypeptide; insl5a, insulin-like peptide 5a; calca, calcitonin. Scale bars, 50 μm. il Fluorescent in situ hybridization (FISH) (DAPI staining shown in grey)

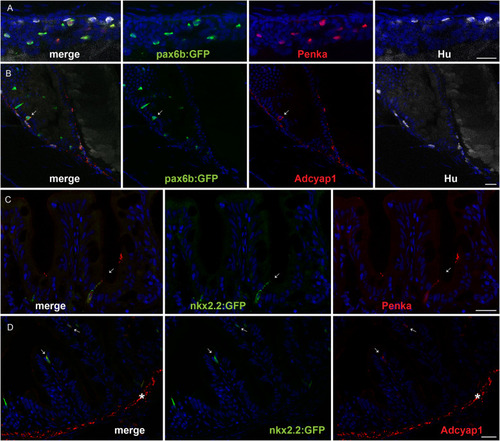
Immunostaining of enkephalin and Adcyap1 in the zebrafish intestine. a, b Confocal images of the intestines from 5-dpf Tg(pax6b:GFP) zebrafish larva stained with antibodies directed against GFP (green), Hu (white), ENKEPHALIN (a; red) or ADCYAP1 (b; red). c, d Confocal images of the intestine of adult Tg(8.5nkx2.2:GFP) stained with antibodies directed against GFP (green), ENKEPHALIN (c; red) or ADCYAP1 (d; red). Arrows show the location of some EECs expressing Adcyap1 (b, d) or enkephalin (c). Adcyap1 immunostaining is also observed at the level of EN axon fibres in gut larva (b) and in the muscularis layer of the adult intestine (shown by an asterisk in d). The zebrafish Adcyap1a and Adcyap1b display respectively 6 and 3 mismatches with human ADCYAP1 at the level of the epitope reacting with the Adcyap1 antibody, explaining the stronger signal of Adcyap1b in EN fibres. (The nkx2.2:GFP transgene is expressed specifically in EECs like Pax6b). Scale bar, 20 μm

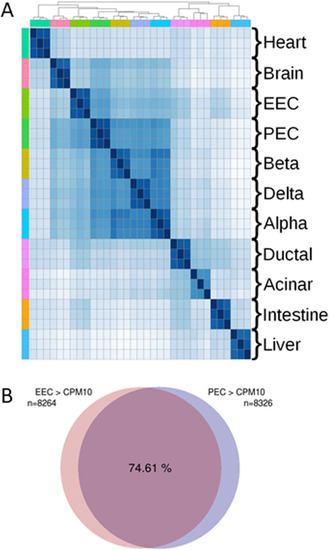
Similar gene expression profiles between zebrafish EECs and PECs. Global comparison of transcriptomic profiles (RNA-seq) from distinct zebrafish tissues/organs. a Clustered heatmap displaying the Euclidean distance matrix between every pair of zebrafish RNA-seq datasets. The order of the different tissues is identical for the two axes (rows and columns) as shown by the different colours on the upper part and left part of the matrix. Each zebrafish tissue (analysed in triplicate) was compared with the other samples as presented in the matrix. Darker colour indicates closer distance (i.e. more similar transcriptomes). EEC transcriptome is mostly similar to the transcriptome of embryonic pancreatic endocrine cells (PECs) or to the adult alpha, beta or delta pancreatic cells. The accession number of all used RNA-seq datasets is given in the “Methods” section. b Venn diagram showing the overlap (74%) of genes expressed in both EECs and PECs above the threshold of 10 CPM. A total of 8264 genes and 8326 genes were expressed above 10 CPM (counts per million) respectively in EECs and in PECs

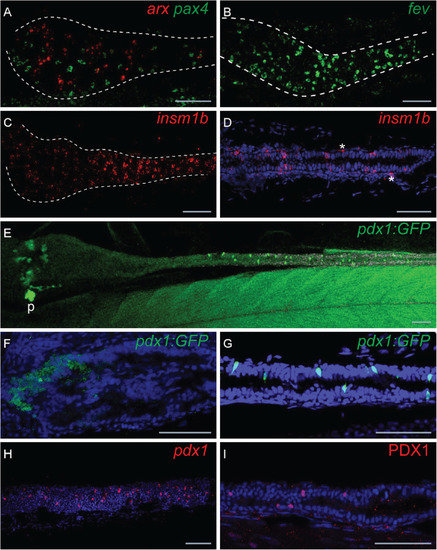
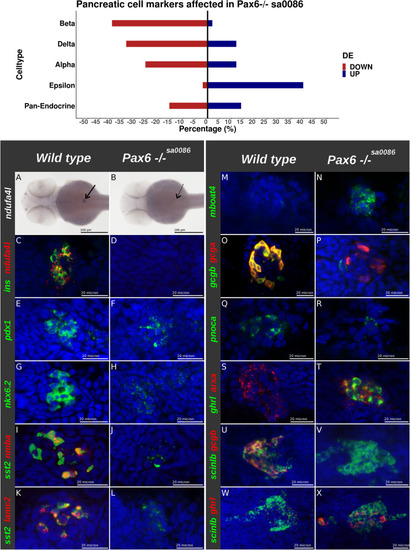
Expression profiles of pax4, arx, pdx1 and fev in the zebrafish gut. Fluorescent in situ hybridization (FISH) performed on 66 hpf (a), 72 hpf (bd) or 96 hpf (ei) embryos. Views of the gut (delimited by dotted lines; anterior to the left) showing the non-overlapping expression of pax4 (green) and arxa (red) (a), numerous EECs expressing fev (b) and insm1b (d). Higher magnification showing insm1+ EECs located within the gut epithelium and insm1+ enteric neurons (shown by asterisks) outside but juxtaposed to the epithelium. e View of the gut from the tg(BAC pdx1:GFP) larvae (GFP immunostaining) with higher magnification of the anterior (f) and posterior (g) parts. FISH using pdx1 probe (h) and immunostaining using Pdx1 antibody. P, pancreas. Scale bars, 20 μM

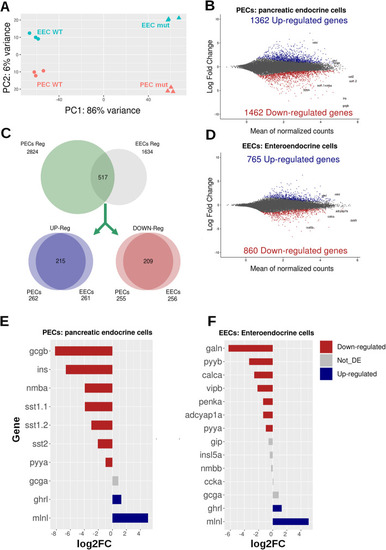
RNA-seq analysis of EECs and PECs from wild-type and pax6b mutants identifies a set of genes displaying similar Pax6b regulation in both the pancreas and intestine. a, Principal component analysis (PCA) on all EEC and PEC RNA-seq data obtained from wild-type and pax6bsa0086 mutants. The close clustering of the triplicate wild-type and mutant samples demonstrates the high reproducibility of the data. b, d MA plots showing all the upregulated (in blue) and downregulated (in red) genes in the pax6bsa0086 mutant PECs (b) and EECs (d). c Venn diagrams showing the overlap of genes regulated in both EECs and PECs; amongst the 517 regulated genes, 215 and 209 genes are respectively up- and downregulated in both cell types as shown in the blue and red Venn diagrams. e, f Expression ratio (in log2 of fold change from pax6b mutant versus wild-type) of hormones expressed in PECs (e) and in EECs (f); downregulated hormones are in red, upregulated hormones are in blue and not statistically are affected in grey; RNA-seq values are shown in Tables 3 and S4

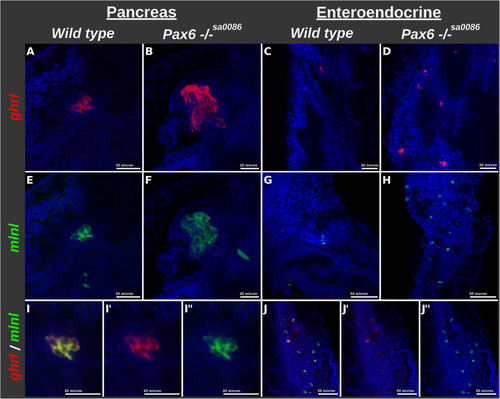
Increase in the number of cells co-expressing ghrl and mlnl in the pax6b−/− PECs and EECs. FISH using ghrelin (ghrl, labelled in red) and motilin-like (mlnl, labelled in green) probes on 2.5 dpf (A, B, E, F and I) and 4.5 dpf (C, D, G, H, J) zebrafish larvae. Confocal views of the pancreatic islet (A, B, E, F) and of the gut (C, D, G, H). I, J Overlays of ghrl (I′ and J′) and mlnl (I″ and J″) stainings demonstrating co-labelling with the two probes. A, E, I, I′, and I″ are views of the pancreatic islet from a wild-type larva while B and F are the pancreatic islet from pax6b−/−. C, G Views of the intestines from wild-type larvae; D, H, J, J′, J″ Views of the gut from a pax6b−/− larvae. Scale bars: 20 microns for A-F and I panels, 50 microns for G, H and J panels

EXPRESSION / LABELING:
Genes:
Fish:
Anatomical Terms:
Stage Range: Pec-fin to Day 4
PHENOTYPE:
Fish:
Observed In:
Stage Range: Pec-fin to Day 4

pax6b inactivation leads to a loss of pancreatic beta cells, reduction of delta cells, increase of epsilon cells and abnormal alpha cells. (Upper panel) percentage of markers from beta-, delta-, alpha-, epsilon- and pan-endocrine cells which are downregulated (in red) or upregulated (in blue) in the pax6b−/− PECs. The list of markers for each cell subtype is shown in Additional file 9: Table S6. The up- or downregulation was determined from RNA-seq data from pax6bsa0086 mutant versus wild-type. (Lower panel) Expression analysis of cell subtype markers by WISH (a, b) and FISH (cx) on 2 dpf zebrafish pax6b mutant and wild-type embryos as noted on the top of the panel; probes are indicated on the left of each picture. Scale bars: 100 µm for panels a and b and 20µm for panels c to x

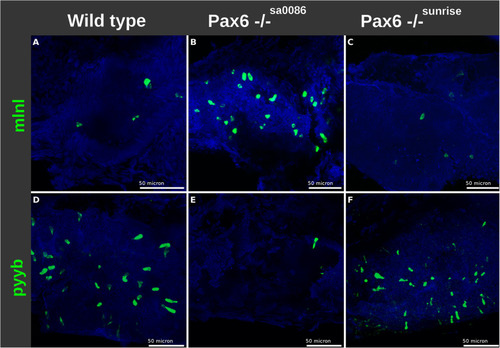
The effect of Pax6b on the number of EEC expressing pyyb and mlnl does not depend on its homeodomain. FISH showing the respective increase of mlnl+ EECs and decrease of pyyb+ EECs in the pax6bsa0086 null mutants (b, e), while the hypomorphic pax6bsunrise mutants harbouring a mutation in pax6b homeobox do not display modifications in the expression of EEC hormones (c, f)

EXPRESSION / LABELING:
Genes:
Fish:
Anatomical Term:
Stage: Day 4
PHENOTYPE:
Fish:
Observed In:
Stage: Day 4

ZFIN is incorporating published figure images and captions as part of an ongoing project. Figures from some publications have not yet been curated, or are not available for display because of copyright restrictions.

ZFIN is incorporating published figure images and captions as part of an ongoing project. Figures from some publications have not yet been curated, or are not available for display because of copyright restrictions.

EXPRESSION / LABELING:
Gene:
Fish:
Anatomical Terms:
Stage: Day 4
Acknowledgments
This image is the copyrighted work of the attributed author or publisher, and ZFIN has permission only to display this image to its users. Additional permissions should be obtained from the applicable author or publisher of the image. Full text @ BMC Biol.