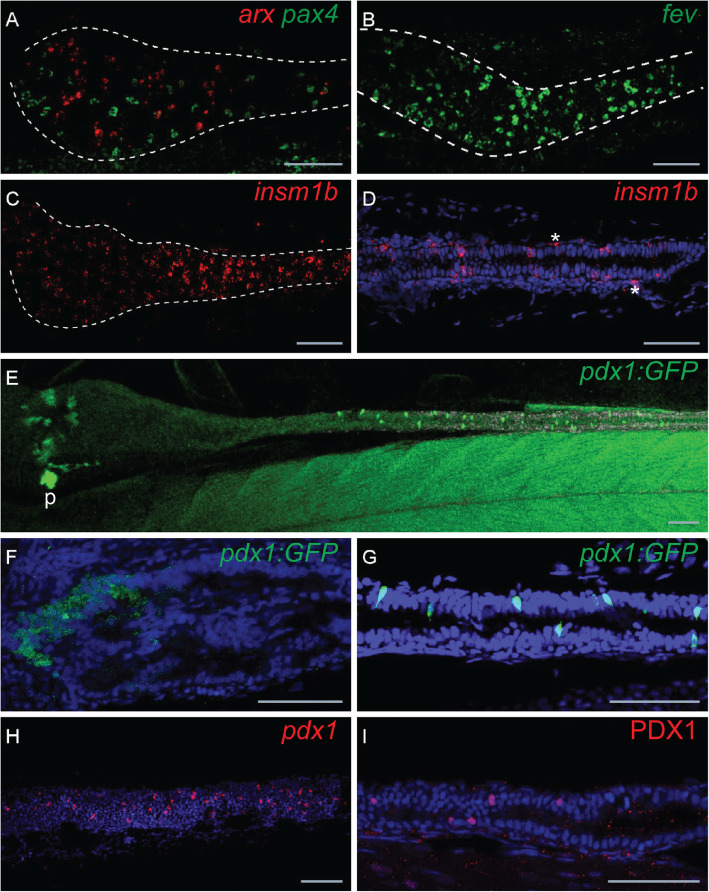
IMAGE

Fig. 4.

ID
ZDB-IMAGE-200904-6
Genes
Antibodies
Source
Figures for Lavergne et al., 2020
Image
Figure Caption

Fig. 4.

Expression profiles of pax4, arx, pdx1 and fev in the zebrafish gut. Fluorescent in situ hybridization (FISH) performed on 66 hpf (a), 72 hpf (bd) or 96 hpf (ei) embryos. Views of the gut (delimited by dotted lines; anterior to the left) showing the non-overlapping expression of pax4 (green) and arxa (red) (a), numerous EECs expressing fev (b) and insm1b (d). Higher magnification showing insm1+ EECs located within the gut epithelium and insm1+ enteric neurons (shown by asterisks) outside but juxtaposed to the epithelium. e View of the gut from the tg(BAC pdx1:GFP) larvae (GFP immunostaining) with higher magnification of the anterior (f) and posterior (g) parts. FISH using pdx1 probe (h) and immunostaining using Pdx1 antibody. P, pancreas. Scale bars, 20 μM

Figure Data
Acknowledgments
This image is the copyrighted work of the attributed author or publisher, and ZFIN has permission only to display this image to its users. Additional permissions should be obtained from the applicable author or publisher of the image. Full text @ BMC Biol.