FIGURE

Fig. 5.

ID
ZDB-FIG-200904-5
Publication
Lavergne et al., 2020 - Pancreatic and intestinal endocrine cells in zebrafish share common transcriptomic signatures and regulatory programmes
Other Figures
All Figure Page
Back to All Figure Page
Fig. 5.

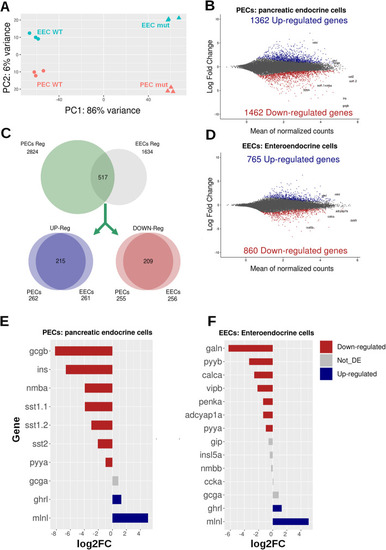
RNA-seq analysis of EECs and PECs from wild-type and pax6b mutants identifies a set of genes displaying similar Pax6b regulation in both the pancreas and intestine. a, Principal component analysis (PCA) on all EEC and PEC RNA-seq data obtained from wild-type and pax6bsa0086 mutants. The close clustering of the triplicate wild-type and mutant samples demonstrates the high reproducibility of the data. b, d MA plots showing all the upregulated (in blue) and downregulated (in red) genes in the pax6bsa0086 mutant PECs (b) and EECs (d). c Venn diagrams showing the overlap of genes regulated in both EECs and PECs; amongst the 517 regulated genes, 215 and 209 genes are respectively up- and downregulated in both cell types as shown in the blue and red Venn diagrams. e, f Expression ratio (in log2 of fold change from pax6b mutant versus wild-type) of hormones expressed in PECs (e) and in EECs (f); downregulated hormones are in red, upregulated hormones are in blue and not statistically are affected in grey; RNA-seq values are shown in Tables 3 and S4

Expression Data

Expression Detail
Antibody Labeling
Phenotype Data

Phenotype Detail
Acknowledgments
This image is the copyrighted work of the attributed author or publisher, and ZFIN has permission only to display this image to its users. Additional permissions should be obtained from the applicable author or publisher of the image. Full text @ BMC Biol.