
- Title
-
Regulation of zebrafish melanocyte development by ligand-dependent BMP signaling
- Authors
- Gramann, A.K., Venkatesan, A.M., Guerin, M., Ceol, C.J.
- Source
- Full text @ Elife
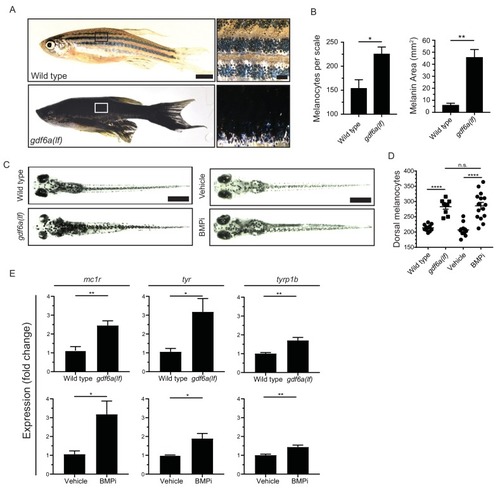
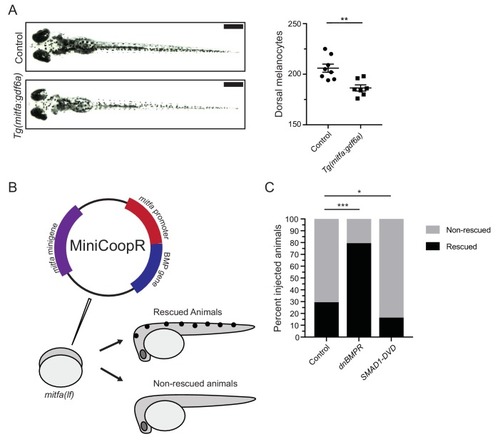
gdf6a loss or BMP inhibition causes the development of supernumerary melanocytes. (A) Images of wild-type and gdf6a(lf) adult zebrafish, scale bar = 4 mm, inset scale bar = 1 mm. (B) Quantification of number of melanocytes (left) and scale pigmentation using melanin coverage (right), n = 3 scales per group. (C) Wild-type and gdf6a(lf) embryos imaged at 5 days post fertilization (DPF); vehicle- and BMPi-treated embryos imaged at 5 DPF. Scale bar = 1 mm. Animals were treated with epinephrine prior to imaging. (D) Quantification of dorsal melanocytes per animal in 5 DPF wild-type, gdf6a(lf) mutant, vehicle-, and BMPi-treated embryos. n = 11, 9, 11, and 15 embryos, respectively, from two independent experiments (N = 2). (E) Expression of melanocyte differentiation markers mc1r, tyr, and tyrp1b by qRT-PCR in wild-type, gdf6a(lf) mutant, vehicle-, and BMPi-treated embryos. n = 5–6 replicates across two independent experiments (N = 2) for each group. Expression was normalized to β-actin. Error bars represent mean + /- SEM. P-values were calculated using Student’s t-test in panel B and E, and one-way ANOVA with Tukey’s multiple comparisons test in panels D, *p<0.05, **p<0.01, ***p<0.001, ****p<0.0001, n.s., not significant. |
( |
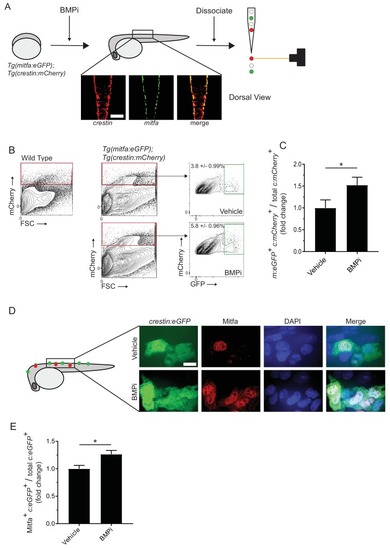
Inhibition of BMP signaling increases mitfa-positive neural crest cells. (A) Diagram of experiment. Tg(crestin:mCherry); Tg(mitfa:eGFP) embryos were treated with BMPi from 12 to 24 HPF. At 24 HPF, embryos were dissociated and analyzed via flow cytometry for GFP- and mCherry-positive cells, scale bar = 200 µm. (B) Gating strategy based on non-transgenic wild-type control to identify crestin:mCherry-positive cells and crestin:mCherry/mitfa:eGFP double-positive cells. Top, control vehicle-treated embryos. Bottom, BMPi-treated embryos. (C) Fold change in crestin:mCherry/mitfa:eGFP double-positive cells per total crestin:mCherry-positive cells in vehicle and BMPi-treated groups, N = 3 biological replicates of 80–100 stage-matched embryos pooled for each condition. m:eGFP, mitfa:eGFP; c:mCherry, crestin:mCherry. (D) anti-Mitfa immunofluorescence in Tg(crestin:eGFP) embryos treated with BMPi or vehicle control and fixed at 24 hr, scaled bar = 10 µm. (E) Fold change in Mitfa/crestin:eGFP double-positive cells per total crestin:eGFP-cells, n = 16 embryos from two independent experiments (N = 2) for each condition. c:eGFP, crestin:eGFP. Error bars represent mean + /- SEM; P-value was calculated using ratio-paired t-test in panel C and Student’s t-test in panel E, *p<0.05 |
( |
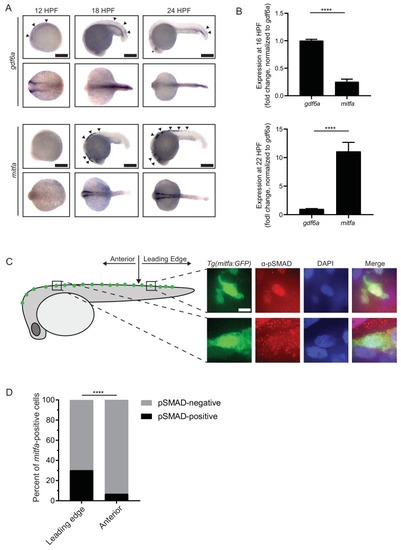
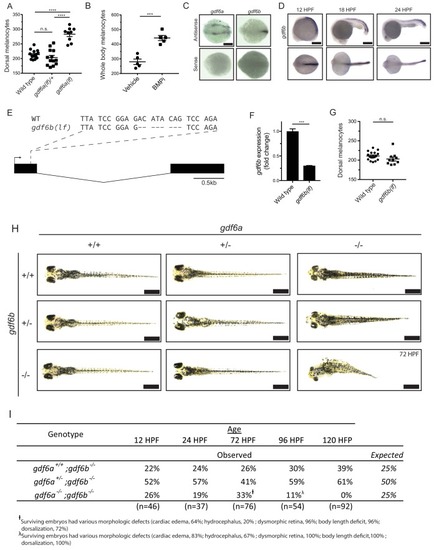
gdf6a expression and BMP activity in pigment progenitor cells. (A) RNA in situ hybridization for gdf6a (top) and mitfa (bottom) at 12-, 18-, and 24 hr post-fertilization. Arrowheads indicate expression domains in the region of the neural crest of gdf6a and mitfa. Asterisk indicates known dorsal retinal expression of gdf6a. Scale bar = 500 µm. (B) Expression of gdf6a and mitfa from neural crest cells isolated from Tg(crestin:eGFP) embryos by FACS at 16 HPF and 22 HPF. Samples were normalized to gdf6a expression. n = 5–6 replicates per conditions from two independent experiments (N = 2). (C) Images of GFP-positive cells from Tg(mitfa:eGFP) zebrafish stained with α-pSMAD 1/5/8 antibody. Scale bar = 10 µm. (D) Quantification of mitfa:eGFP-positive cells that are phospho-SMAD1/5/8-positive. The leading edge encompassed the five most posterior mitfa-positive cells, whereas anterior cells constituted any mitfa-positive cells anterior to the leading edge. n = 102 and 186 for distal leading edge and anterior cells, respectively, from three independent experiments (N = 3). P-values were calculated using Fisher’s exact test for panels B and D, ****p<0.0001. EXPRESSION / LABELING:
|
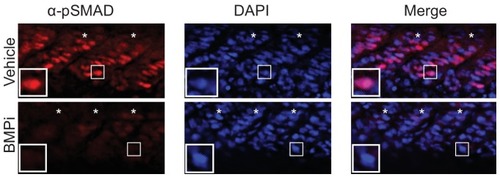
Insets show individual nuclei. Photomicrographs for pSMAD-1/5/8-stained embryos were taken at the same exposure settings. |
( PHENOTYPE:
|
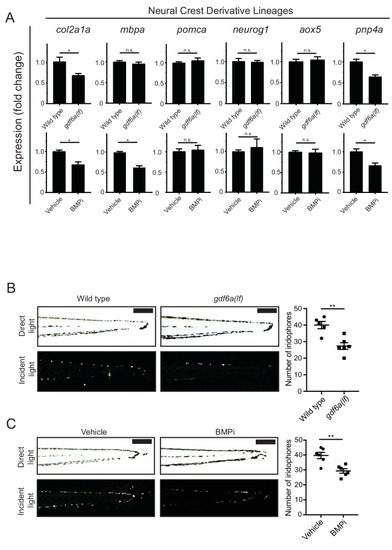
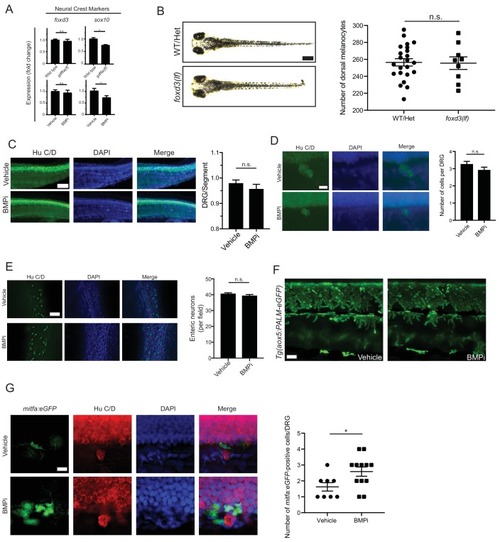
gdf6a loss and BMP inhibition impact development of specific neural crest derivatives. (A) Expression analyses of multiple neural crest and neural crest derivative lineage markers. qRT-PCR was used to assess changes in markers of neural crest markers and neural crest derivatives in gdf6a(lf) embryonic zebrafish (top) and BMPi-treated wild-type zebrafish (bottom) at 5 DPF; col2a1a, chondrocytes; mbpa, glial; pomca, adrenal medullary cells; neurog1, neuronal cells; aox5, xanthophores; pnp4a, iridophores; n = 5–6 for each group from two independent experiments (N = 2). (B) Direct light (top) and incident light (bottom) images of wild-type and gdf6a(lf) embryos at 5 DPF and quantification of dorsal iridophores (right) per animal in each group. Animals were treated with epinephrine prior to imaging at 5 DPF; n = 5 and 6 for wild-type and gdf6a(lf) groups, respectively, from two independent experiments (N = 2); scale bar = 500 µm. (C) Direct light, top, and incident light, bottom, images of wild-type embryos treated with vehicle or BMPi from 12 to 24 HPF and quantification of dorsal iridophores, right, per animal in vehicle and BMPi treated groups. Animals treated with epinephrine prior to imaging at 5 DPF, n = 6 and 6 for vehicle and BMPi groups, respectively, from two independent experiments (N = 2); scale bar = 1 mm. Error bars represent mean + /- SEM, P-values calculated with Student’s t-test, *p<0.05, **p<0.01, n.s., not significant. |
( |

BMP inhibition impacts fate specification of mitfa-positive pigment progenitor cells. (A) Diagram of lineage tracing experiment. Embryos containing Tg(ubi:switch) were injected with a mitfa:Cre-ERT2 construct and treated with BMPi and tamoxifen (4-OHT) from 12 to 24 HPF to block BMP signaling and allow Cre recombination. At 5 DPF, animals were screened for successful recombination by presence of single mCherry-labeled pigment cells, and the identities of those cells were assessed using incident light. Scale bar = 40 µm. (B) Quantification of mCherry-labeled cell fates at 5 DPF in vehicle and BMPi-treated animals, n = 101 and 80 labeled cells for vehicle and BMPi groups, respectively, from five independent experiments (N = 5); P-value calculated using Fisher’s exact test, *p<0.05. |
P-value was calculated using Fisher’s exact test, p<0.05. |
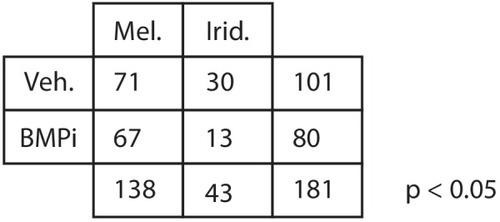
BMP signaling regulates expression of and acts through mitfa to impact pigment cell fates. (A) mitfa expression in sorted GFP-positive cells from Tg(crestin:eGFP) and Tg(mitfa:eGFP) embryos treated with vehicle or BMPi from 12 to 24 HPF, n = 4–5 replicates for each condition from two independent experiments (N = 2). (B) anti-Mitfa immunofluorescence, DAPI and merged images of Tg(crestin:eGFP) embryos treated with vehicle control or BMPi in GFP-positive cells (top) and GFP-negative cells (bottom), scale bar = 5 µm. (C) Quantification of anti-Mitfa fluorescence intensity of individual nuclei in GFP-positive cells (top) and GFP-negative cells (bottom); n = 65 and 74 for GFP-positive vehicle and BMPi groups, respectively; n = 35 and 30 for GFP-negative vehicle and BMPi groups, respectively, from three independent experiments (N = 3). (D) Incident light images of mitfa(lf) embryonic zebrafish treated with vehicle or BMPi from 12 to 24 HPF and imaged at 5 DPF, scale bar = 1 mm. (E) Quantification of dorsal iridophores in mitfa(lf) embryonic zebrafish treated with vehicle or BMPi from 12 to 24 HPF, n = 7 and 9 for vehicle and BMPi groups, respectively, from two independent experiments (N = 2). Error bars represent mean + /- SEM, P-value was calculated using one-way ANOVA with Tukey’s multiple comparisons test in panel A and Student’s t-test in panel C and E. *p<0.05, ***p<0.001, ****p<0.0001, n.s., not significant. |
( |