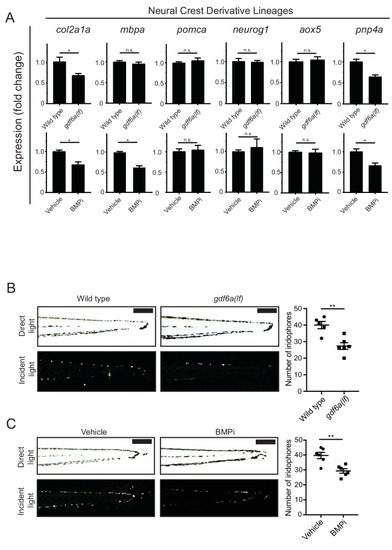
gdf6a loss and BMP inhibition impact development of specific neural crest derivatives. (A) Expression analyses of multiple neural crest and neural crest derivative lineage markers. qRT-PCR was used to assess changes in markers of neural crest markers and neural crest derivatives in gdf6a(lf) embryonic zebrafish (top) and BMPi-treated wild-type zebrafish (bottom) at 5 DPF; col2a1a, chondrocytes; mbpa, glial; pomca, adrenal medullary cells; neurog1, neuronal cells; aox5, xanthophores; pnp4a, iridophores; n = 5–6 for each group from two independent experiments (N = 2). (B) Direct light (top) and incident light (bottom) images of wild-type and gdf6a(lf) embryos at 5 DPF and quantification of dorsal iridophores (right) per animal in each group. Animals were treated with epinephrine prior to imaging at 5 DPF; n = 5 and 6 for wild-type and gdf6a(lf) groups, respectively, from two independent experiments (N = 2); scale bar = 500 µm. (C) Direct light, top, and incident light, bottom, images of wild-type embryos treated with vehicle or BMPi from 12 to 24 HPF and quantification of dorsal iridophores, right, per animal in vehicle and BMPi treated groups. Animals treated with epinephrine prior to imaging at 5 DPF, n = 6 and 6 for vehicle and BMPi groups, respectively, from two independent experiments (N = 2); scale bar = 1 mm. Error bars represent mean + /- SEM, P-values calculated with Student’s t-test, *p<0.05, **p<0.01, n.s., not significant.
|
