
- Title
-
Mutations in Zebrafish lrp2 Result in Adult-Onset Ocular Pathogenesis That Models Myopia and Other Risk Factors for Glaucoma
- Authors
- Veth, K.N., Willer, J.R., Collery, R.F., Gray, M.P., Willer, G.B., Wagner, D.S., Mullins, M.C., Udvadia, A.J., Smith, R.S., John, S.W., Gregg, R.G., and Link, B.A.
- Source
- Full text @ PLoS Genet.
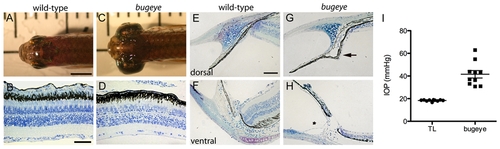
Adult bugeye zebrafish have enlarged eye globes, thinned retinas, and elevated intraocular pressure without iridocorneal angle obstruction or malformation. A,C Dorsal views of adult wild-type (A) and bugeye (C) zebrafish. B,D Histology of central retina sections at 6 months in wild-type (B) and mutant (D) eyes. E-H Histology of wild-type (E,F) and bugeye mutant (G,H) iridocorneal angles in the dorsal region (E,G) or at the ventral canalicular aqueous humor drainage region (F,H). I Intraocular pressures (IOP) in adult wild-type and bugeye zebrafish. IOPs in bugeye fish were elevated compared to age and size matched fish from TL wild-type stain (p<0.0001, t-test). Scale bars: A,C = 4 mm; B,D = 50 μm; E-H = 40 μm. PHENOTYPE:
|

Both bugeyemw1 and bugeyep5bnc mutants have non-sense mutations in lrp2. A Genetic and corresponding physical map of the critical interval for bugeyemw1 and bugeyep5bnc locus on chromosome 9. Associated number of recombination events per 270 meioses are shown for each polymorphic marker. SSR, Simple sequence repeat. B Sequence comparisons of lrp2 revealed distinct non-sense mutations in bugeyemw1 and bugeyep5bnc. In mw1, the cysteine at amino acid position 23 is changed to a stop codon by a T>A mutation; in p5bnc, the glutamine at 413 is changed to a stop by a C>T mutation. In both, heterozygous genotypes show both alleles. C Model of Lrp2 protein structural domains, with the locations of the identified mutations indicated by arrows. The bulk of the protein is extracellular with ligand binding domains, while the intracellular domain contains an NPXY endocytosis sequence motif. D-E Immunostaining for Lrp2 in 56-hpf pigmentation-blocked embryos. Lrp2 immunoreactivity was robust in the retina pigmented epithelium (RPE) of wild-types (D), but absent in bugeye embryos (E). Insets in D and E are magnified in D′ and E′. Scale bars = 25 �m; circles show placement of the lenses. F Images of ethidium bromide stained agarose gels show restriction fragment length polymorphism (RFLP) genotypes: homozygous mutant (-/-), heterozygote (+/-) and wild-type (+/+) genotype for each mutation. EXPRESSION / LABELING:
|
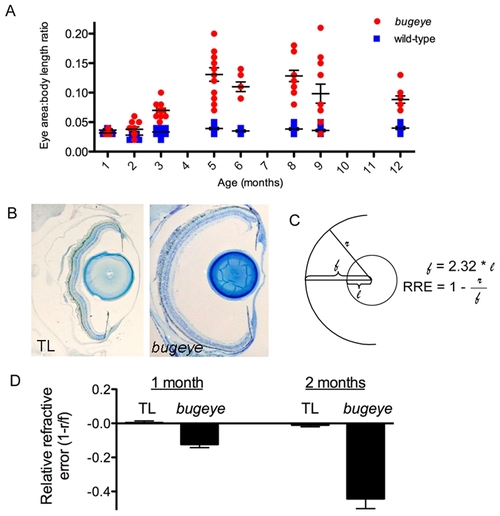
Eye growth and relative refractive errors in bugeye/lrp2 mutants. A bugeye mutants have a greater eye area to body length ratio (E:B) than age-matched wild-types beginning at 2 months (p<0.05, t-test), which becomes more pronounced with age. Each dot represents the E:B for an individual eye. B Histological transverse sections through the whole eye show an increased depth of the vitreous chamber (from the lens to retina) in bugeye (right) as compared to wild-type fish (left). C Diagram showing the calculation of relative refractive error (RRE): lens radius (l) and retina radius (r), using a focal length of the lens (f) as 2.32 x lens radius. D The RRE measurements revealed mild but significant myopia in 1-month bugeye fish (p = 0.0002, t-test), that becomes more dramatic at 2 months of age (p<0.0001, t-test). n = 6 eyes each for 1 month TL and bugeye; n = 16 and 22 eyes for 2 month TL wild-type and bugeye, respectively. PHENOTYPE:
|

Retinal cell density. Semi-thin plastic sections of the central retina, with associated quantification of cell density in each neural layer at 1 (A?B), 2 (C?D), and 6 (E?F) months in TL and bugeye. Scale bar A?E = 50 μm. *p<0.05, ***p<0.001, t-test; FOV, field of view. PHENOTYPE:
|
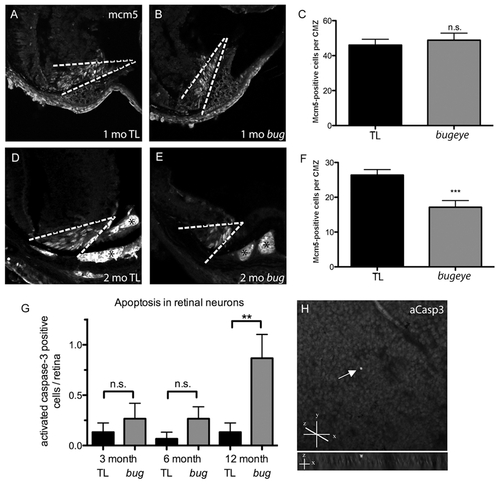
Retinal proliferation and apoptosis. A?F Mcm5 expression in 1 (A?C) and 2-month (D?F) cryosections. Dashed white lines denote proliferative ciliary marginal zone (CMZ) of the retina; asterisks indicate autofluorescent blood vessels. G Quantitation of apoptotic cells identified on whole retina flat-mounts by activated caspase-3 (aCasp3) immunofluorescence. H Confocal images of aCasp3-positive cell in 1 year old bugeye mutant. Upper shows compressed z-stacks, lower shows 90°rotation to reveal z location of positive cell (arrow). The flat mounted retinas were orientated with retinal ganglion cell layer up. n = 15 eyes for each condition; ***p<0.001, **p<0.01, n.s., not significant (t-test). PHENOTYPE:
|
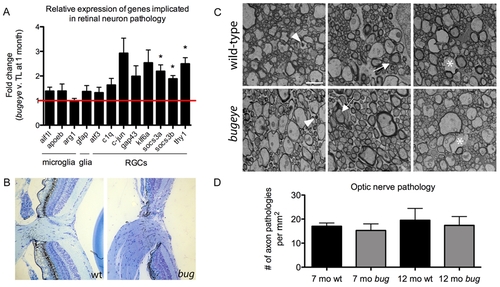
Analysis of retinal and optic nerve head pathology. A The relative expression levels of genes previously associated with retinal neuron pathology measured by real-time PCR on cDNA made from RNA isolated from the eyes of 1-month TL and bugeye fish. The cell populations that predominantly express the marker genes are listed below the bar graph. n = 4 independent samples of 6 pooled eyes each from TL wild-type and bugeye mutant fish. Error bars show standard error of the mean; *p<0.05. B Histological cross sections through the optic nerve head in TL wild-type (left) and bugeye (right) samples a 6 months of age. C Representative electron micrographs showing each type of axon pathology observed in cross-sections of TL wild-type (top) and bugeye (bottom) optic nerves. Arrowheads (left), degenerating axon; arrows (middle), unraveling myelin sheath; asterisks (right), lost axon. Scale bar = 2 μm. D Quantification of the optic nerve ultrastructure analysis reported as number of axon pathologies per mm2. n = 6 and 7 nerves for 7- and 12-month TL wild-type, respectively; n = 8 nerves each for 7- and 12-month bugeye. EXPRESSION / LABELING:
PHENOTYPE:
|
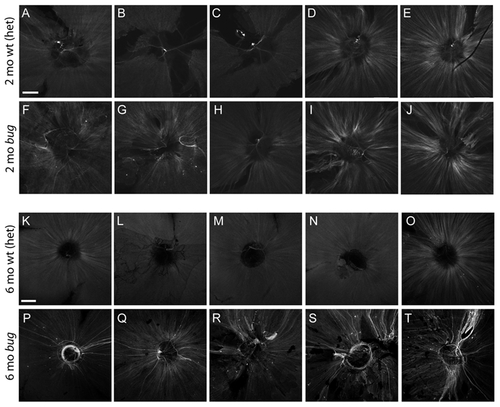
Expression of the gap43:GFP transgene in lrp2 mutants. A?L Expression of the gap43:GFP transgene in flat-mounted retinas from 2-month bugeye heterozygotes (wild-type) (A?E) and homozygous mutants (F?J). Shown are 5 representative samples for each condition. Images capture a single plane of the nerve fiber layer using equal gain settings on a confocal microscope. Scale bar = 200 μm. Similar analysis on 6-month bugeye heterozygotes (wild-type) (K?O) and homozygous mutants (P?T). Note the stronger activation and unique wandering/circling phenotype in mutant axons. EXPRESSION / LABELING:
PHENOTYPE:
|
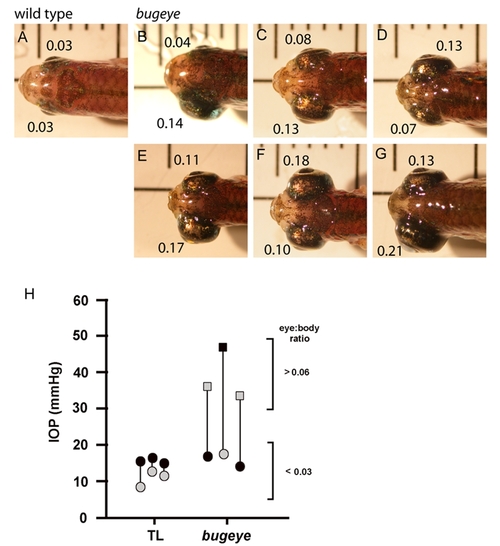
A-G bugeye mutants show varying degrees of asymmetry in eye size (B-G), with the smaller of the two eyes only occasionally falling within the range of the wild-type eye size to body length ratio (E:B; wild-type E:B < 0.05, bugeye E:B >0.06). For each eye, the E:B is indicated. H In asymmetric eyes of bugeye fish, intraocular pressure (IOP) was elevated only in the enlarged eyes. In TL wild-type, the eye measured for IOP first had a higher value than the second eye measured in the same fish. Black symbols represent the first eye of a fish that was measured for IOP and gray symbols represent the second eye. The vertical bar connecting symbols shows eyes from the same fish. Circles represent normal sized eyes; squares represent enlarged eyes. |
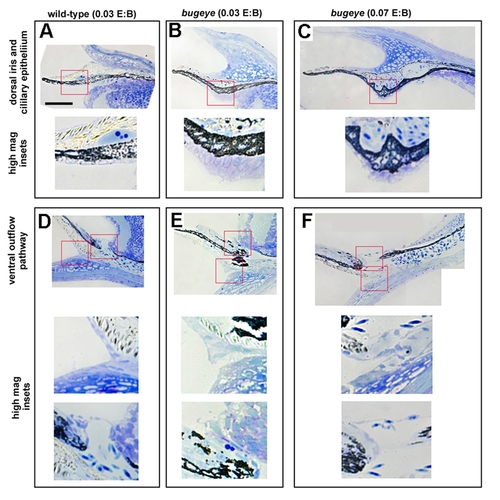
Iridocorneal angle histology of 2.5 month old wild-type (A-,D), normal eyed bugeye mutants (B-E), and large-eyed bugeye mutants (C-F). A-C. Dorsal ciliary epithium. D-F, ventral canalicular outflow pathway. Red boxes show from where high magnification isets were derived. Scale bar = 50 μm. Insets are magnified 2.5X. Note the elongated and dysplasic ciliary epithelial cells in B and C insets. |
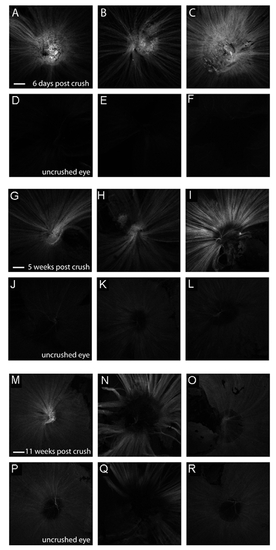
Expression of the gap43:GFP transgene following optic nerve crush in adult (6 month old) wild-type fish. A-F Expression of the gap43:GFP transgene in experimental eyes 6 days after optic nerve crush (A-D) or in the contralateral uncrushed control eye (E-F). G-L Expression of the gap43:GFP transgene in experimental eyes 5 weeks after optic nerve crush (I-L) or in the contralateral uncrushed control eyes (M-P). M-R Expression of the gap43:GFP transgene in experimental eyes 11 weeks after optic nerve crush (Q-T) or in the contralateral uncrushed control eyes (E-F). Shown are 3 representative samples for each condition. Images capture a single plane of the nerve fiber layer using equal gain settings on a confocal microscope. Scale bar = 200μm. |

Unillustrated author statements EXPRESSION / LABELING:
PHENOTYPE:
|