
Fig. 7
|
Fig. 7
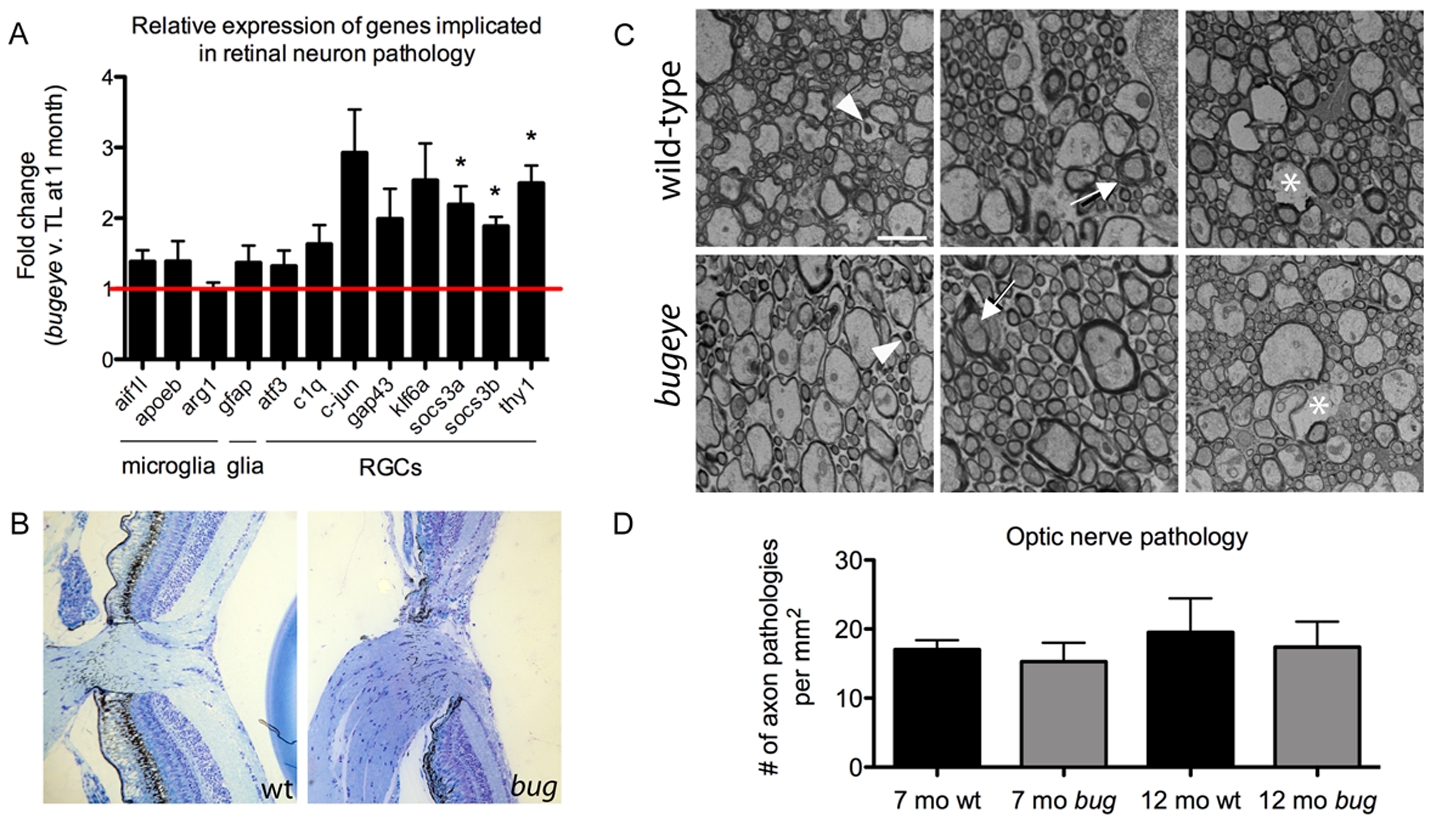
Analysis of retinal and optic nerve head pathology.
A The relative expression levels of genes previously associated with retinal neuron pathology measured by real-time PCR on cDNA made from RNA isolated from the eyes of 1-month TL and bugeye fish. The cell populations that predominantly express the marker genes are listed below the bar graph. n = 4 independent samples of 6 pooled eyes each from TL wild-type and bugeye mutant fish. Error bars show standard error of the mean; *p<0.05. B Histological cross sections through the optic nerve head in TL wild-type (left) and bugeye (right) samples a 6 months of age. C Representative electron micrographs showing each type of axon pathology observed in cross-sections of TL wild-type (top) and bugeye (bottom) optic nerves. Arrowheads (left), degenerating axon; arrows (middle), unraveling myelin sheath; asterisks (right), lost axon. Scale bar = 2 μm. D Quantification of the optic nerve ultrastructure analysis reported as number of axon pathologies per mm2. n = 6 and 7 nerves for 7- and 12-month TL wild-type, respectively; n = 8 nerves each for 7- and 12-month bugeye.