
Fig. S6
- ID
- ZDB-FIG-170619-9
- Publication
- Minchin et al., 2017 - A classification system for zebrafish adipose tissues
- Other Figures
- All Figure Page
- Back to All Figure Page
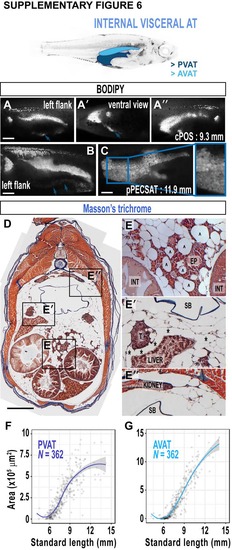
Growth characteristics of pancreatic (PVAT) and abdominal VAT (AVAT). A-A''. Representative images of PVAT flank asymmetry. The left flank (A) is almost devoid of PVAT in 9.3 mm fish, except for a small streak along the ventral midline (arrows, A & A'). The right flank exhibits standard PVAT morphology (A''). B. In larger animals a faint PVAT streak on the left flank is visible located between the looped intestinal tract (arrows). This image is the left flank of the same fish from Fig. S5I. C. PVAT and AVAT become pressed against each other; however, a line distinguishing these depots is visible. D. Paraffin-processed cross-section through an adult zebrafish trunk, stained with Masson's trichrome to label collagen (blue), nuclei (dark red/purple) and cytoplasm (red/pink). E. PVAT-LDs are studded within the exocrine pancreas (EP). E'. A gap separating AVAT and the liver is seen in sections (asterisks). This gap closes when AVAT meets PVAT (far right of image). Note the adipocytes studded in the testes (T). E''. The dorsalmost AVAT connects with the lateral extremes of the kidney. F. Relationship between SL and PVAT area. G. Relationship between SL and AVAT area. Scale bars are 500 µm. EP = exocrine pancreas, INT = intestinal tract, T = testes. All fluorescent confocal and stereoscope images are of the right flank unless otherwise stated. Fitted lines were generated by a LOESS function. |