
FIGURE
Fig. S16
- ID
- ZDB-FIG-170619-19
- Publication
- Minchin et al., 2017 - A classification system for zebrafish adipose tissues
- Other Figures
- All Figure Page
- Back to All Figure Page
Fig. S16
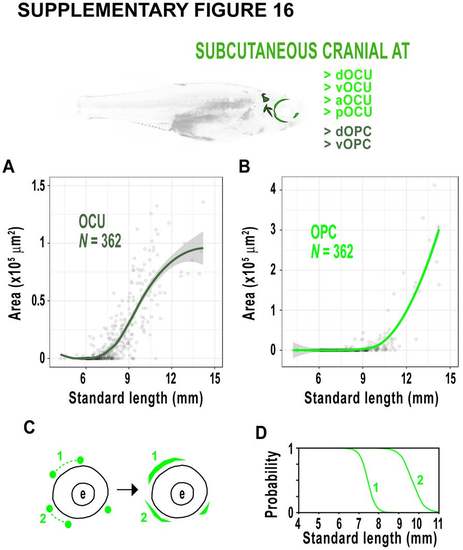
Ocular (OCU) and opercular (OPC) AT development.A. The relationship between SL and OCU. B. The relationship between SL and OCU. C,D. Schematic of the OCU depots. dOPC (1) is initially 2 clusters that connect to form an elongated AT across the dorsal eye. Posterior OPC (pOPC) and ventral OPC (vOPC) sometimes connect (2) at a later stage indicated by logistic regression (D). Fitted lines were generated by a LOESS function in A & B. |
Expression Data
Expression Detail
Antibody Labeling
Phenotype Data
Phenotype Detail
Acknowledgments
This image is the copyrighted work of the attributed author or publisher, and
ZFIN has permission only to display this image to its users.
Additional permissions should be obtained from the applicable author or publisher of the image.
Full text @ Dis. Model. Mech.