
FIGURE
Fig. S7
- ID
- ZDB-FIG-170619-10
- Publication
- Minchin et al., 2017 - A classification system for zebrafish adipose tissues
- Other Figures
- All Figure Page
- Back to All Figure Page
Fig. S7
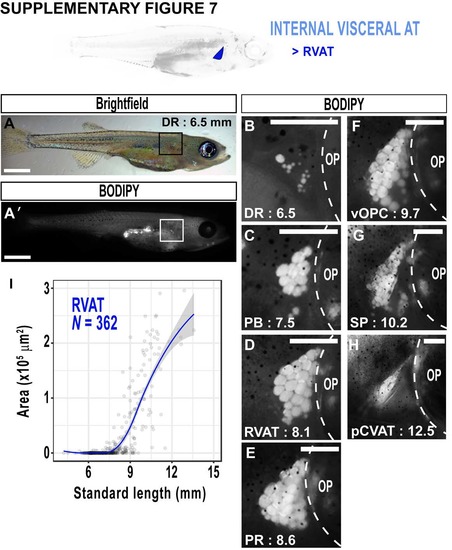
Growth characteristics of renal VAT (RVAT). A,A'. Brightfield image if zebrafish illustrating position of RVAT (box) (A), and corresponding BODIPY image (A'). B-H. Timeseries indicating the progression of RVAT growth. The images are from the region boxed in A. I. Relationship between SL and RVAT area. Scale bars are; 1 mm (A & A'), 250 µm (B-H). Dotted lines in B-H indicate the edge of the operculum. OP = operculum. Fitted lines were generated by a LOESS function. |
Expression Data
Expression Detail
Antibody Labeling
Phenotype Data
Phenotype Detail
Acknowledgments
This image is the copyrighted work of the attributed author or publisher, and
ZFIN has permission only to display this image to its users.
Additional permissions should be obtained from the applicable author or publisher of the image.
Full text @ Dis. Model. Mech.