
Fig. S18
- ID
- ZDB-FIG-170619-21
- Publication
- Minchin et al., 2017 - A classification system for zebrafish adipose tissues
- Other Figures
- All Figure Page
- Back to All Figure Page
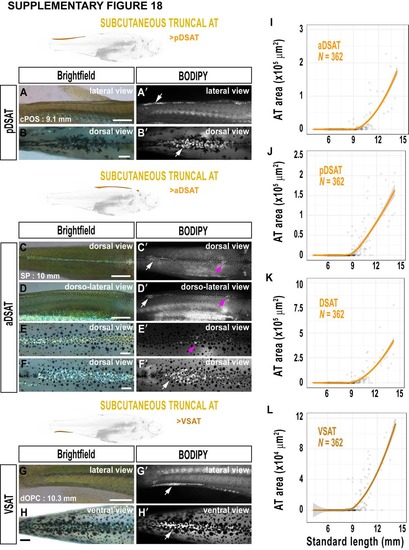
Dorsal (DSAT and ventral (VSAT) stretches of subcutaneous truncal AT in zebrafish. A-B'. Brightfield (A & B) and BODIPY labelled (A' & B') images of posterior DSAT (pDSAT; posterior to the dorsal fin), from lateral (A & A') and dorsal (B & B') views. Arrows indicate pDSAT. C-F'. Brightfield (C-F) and BODIPY+ (C'-F') of anterior DSAT (aDSAT; anterior to the dorsal fin). Arrows indicate the anterior (magenta) and posterior (white) clusters of aDSAT. G-H'. Brightfield (G & H) and BODIPY stained images (G'-H') illustrating location of VSAT (arrows). I-L. Boxplots showing the relationship between DSAT, VSAT and SL. Scale bars are 500 μm (A, A', C-D', G & G'), and 250 μm (B, B', EF' and H-H'). Fitted lines were generated by a LOESS function. |