
Fig. S5
- ID
- ZDB-FIG-170619-8
- Publication
- Minchin et al., 2017 - A classification system for zebrafish adipose tissues
- Other Figures
- All Figure Page
- Back to All Figure Page
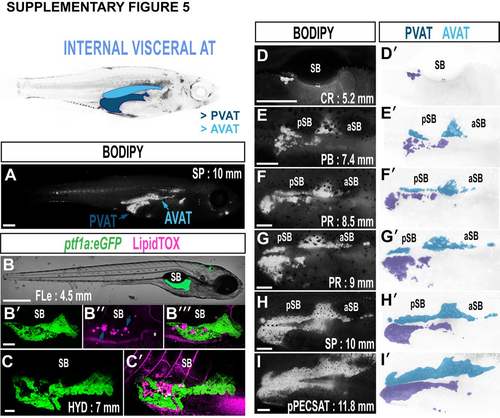
Growth characteristics of pancreatic (PVAT) and abdominal VAT (AVAT). A. BODIPY-stained zebrafish illustrating the location of PVAT and AVAT. B-C'. Maximum intensity projections of PVAT-LD localization to the exocrine pancreas. ptf1a:eGFP labels acinar cells of the exocrine pancreas (green), and LipidTOX labels neutral lipids (magenta). Spherical LipidTOX is contained within LDs (arrows), however neutral lipid in the circulation is also evident (asterisk marks the hepatic portal vein). D-I. Timeseries of BODIPY-labelled PVAT and AVAT reveals distinct morphological transitions during the growth. PVAT was the first AT to appear in 100% of fish in this study. D'-I'. False coloured images depicting PVAT (dark blue) and AVAT (light blue). Images are derived from D-I. Scale bars are; 500 µm (A), 500 µm (B), 100 µm (B'), 500 µm (C), 250 µm (D-I). SB = swim bladder, aSB = anterior swim bladder, pSB = posterior swim bladder. All fluorescent confocal and stereoscope images are of the right flank. |