
FIGURE
Fig. S23
- ID
- ZDB-FIG-170619-26
- Publication
- Minchin et al., 2017 - A classification system for zebrafish adipose tissues
- Other Figures
- All Figure Page
- Back to All Figure Page
Fig. S23
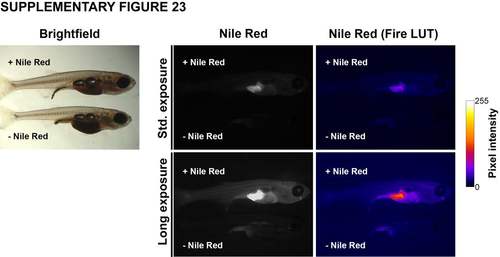
Levels of autofluorescence do not interfere with measurement of AT area in FLD stained zebrafish. Brightfield (left panel) image of two postembryonc zebrafish. Fluorescence image of a Nile Red stained postembryonic fish (upper fish) and a ‘no-dye’ control not stained with Nile Red (lower fish). Background levels in the ‘no-dye’ control are minimal, and do not interfere with measuring AT area. |
Expression Data
Expression Detail
Antibody Labeling
Phenotype Data
Phenotype Detail
Acknowledgments
This image is the copyrighted work of the attributed author or publisher, and
ZFIN has permission only to display this image to its users.
Additional permissions should be obtained from the applicable author or publisher of the image.
Full text @ Dis. Model. Mech.