
Fig. S17
- ID
- ZDB-FIG-170619-20
- Publication
- Minchin et al., 2017 - A classification system for zebrafish adipose tissues
- Other Figures
- All Figure Page
- Back to All Figure Page
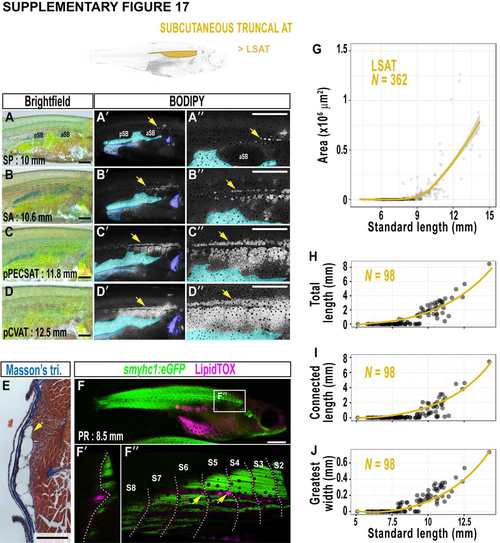
Lateral SAT (LSAT) expands to cover the zebrafish flank. A-D. Brightfield images of the zebrafish flank. A'-D'. Corresponding fluorescence stereoscope images of BODIPY stained zebrafish. LSAT is indicated by arrows. Blue regions correspond to AVAT (cyan), PVAT (light blue) and RVAT (dark blue). Fish are the same as A-D. A''-D''. Magnified images of BODIPY staining on the zebrafish flank. LSAT is indicated by arrows and AVAT is false coloured cyan. E. Masson's trichrome-stained cross-section of LSAT (arrow) in a subcutaneous position. F-F''. Fluorescent stereoscope image (F) of smyhc1:eGFP transgenic fish labelling slow muscle (green) counterstained with LipidTOX (magenta) to label neutral lipid. A single Z-stack slice in the Z axis (F') confirms LDs (magenta) are superficial to the slow muscle (green). Maximum intensity projection to reveal small LSAT-LDs at the horizontal myoseptum (arrows). S2-8 indicate somites 2- 8. G. The relationship between LSAT and SL. H. Total length of LSAT relative to SL. I. Length of longest connected stretch of LSAT relative to SL. J. Greatest width of LSAT relative to SL. Scale bars are 500 μm (A-D and A''-D''), 250 μm (E) and 1 mm (F). pSB = posterior swim bladder, aSB = anterior swim bladder. Fitted lines were generated by a LOESS function. |