
FIGURE
Fig. S20
- ID
- ZDB-FIG-170619-23
- Publication
- Minchin et al., 2017 - A classification system for zebrafish adipose tissues
- Other Figures
- All Figure Page
- Back to All Figure Page
Fig. S20
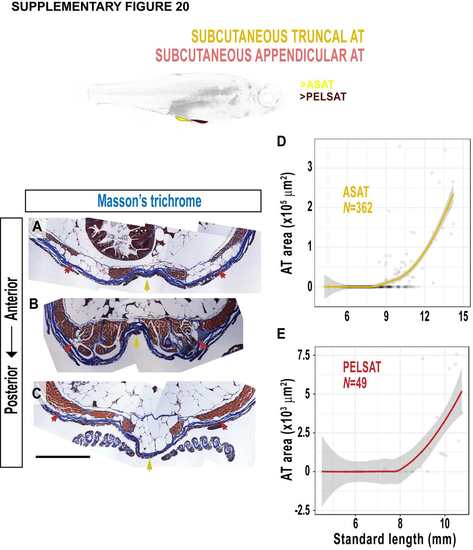
Morphology of abdominal SAT (ASAT) and SAT associated with the pelvic fin (PELSAT). A-C. Masson’s trichrome-stained cross-sections to view ASAT (yellow arrows) and PELSAT (red arrows) at distinct anterior-posterior levels. D, E. Relationship of the area of ASAT (D) and PELSAT (E) relative to SL. Scale bars is 500 μm. Fitted lines were generated by a LOESS function. |
Expression Data
Expression Detail
Antibody Labeling
Phenotype Data
Phenotype Detail
Acknowledgments
This image is the copyrighted work of the attributed author or publisher, and
ZFIN has permission only to display this image to its users.
Additional permissions should be obtained from the applicable author or publisher of the image.
Full text @ Dis. Model. Mech.