
Fig. S11
- ID
- ZDB-FIG-170619-14
- Publication
- Minchin et al., 2017 - A classification system for zebrafish adipose tissues
- Other Figures
- All Figure Page
- Back to All Figure Page
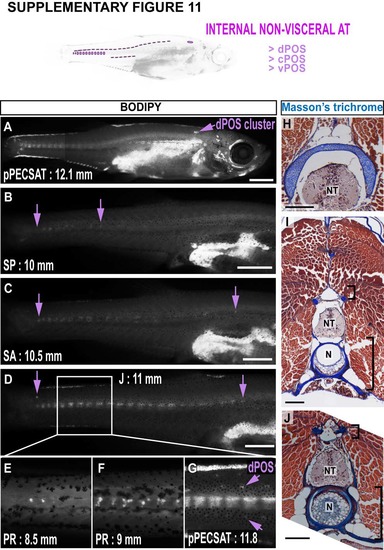
Development of paraosseal NVAT (POS) in zebrafish. A-D. A timeseries illustrating the development of POS. cPOS is most readily evident and it’s anteriorposterior extremes are indicated by arrows (B-D). Note the cluster of dPOS in the anterior trunk (A). E-G. Magnified images of the zebrafish tail region. Note the increasing intensity of cPOS in larger animals (central ‘stripe’), and the emergence of dPOS and vPOS on either side (arrows in G). H-J. Masson’s trichrome-stained cross-sections through adult zebrafish trunk regions. Note the dPOS cluster is located immediately dorsal the neural tube in an anterior region (H), and the continued location of dPOS close to the NT more posteriorly (small bracket, I & J). Also note the larger spread of cPOS in posterior locations (large bracket, I & J). Scale bars are 1 mm (A), 500 µm (B-D) and 250 µm (H-J). NT = neural tube. N = notochord. |