
- Title
-
Activation of ankrd1a expression marks newly forming myofibers and regulates muscle cell differentiation in adult zebrafish skeletal muscle repair
- Authors
- Milovanovic, M., Novkovic, M., Boskovic, S., Marí N Juez, R., Milicevic, A., Jasnic, J., Milosevic, E., Ilic, B., Stainier, D.Y.R., Kojic, S.
- Source
- Full text @ Am. J. Physiol. Cell Physiol.
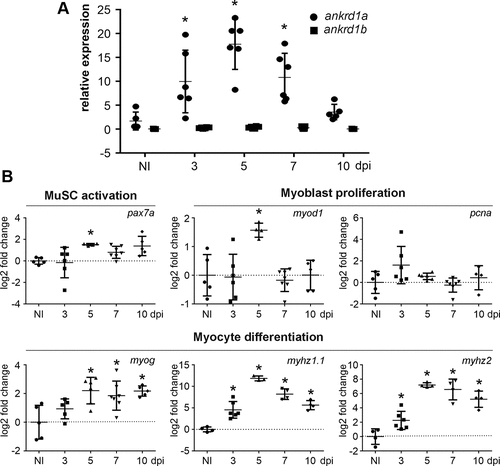
Upregulation of endogenous ankrd1a expression in injured adult zebrafish skeletal muscle correlates with the expression of genes activated during several phases of skeletal muscle repair. mRNA levels of ankrd1a and ankrd1b (A) and representative marker genes involved in the activation of satellite cells (pax7a), myoblast proliferation (myod1 and pcna), and myocyte differentiation [myogenin (myog) and myosin heavy chain isoforms 1.1 (myhz1.1) and 2 (myhz2)] (B) were assessed at 3, 5, 7, and 10 days postinjury (dpi) by RT-qPCR. At least 3 zebrafish were used per experimental group. RNA isolated from the skeletal muscle of noninjured zebrafish served as a control (NI). The data for A are presented as fold change ± SD, normalized to the ankrd1a expression level in noninjured control. The data on B are presented as mean log2 fold change ± SD. The exact P values are given in Supplemental Table S8. Average Ct values ± SD are listed in Supplemental Table S3. MuSC, muscle satellite cells. *P ≤ 0.05. |
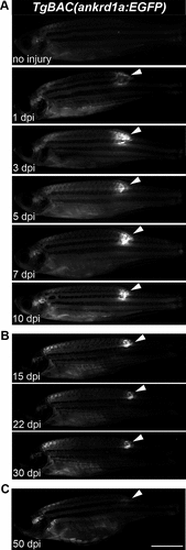
Expression of TgBAC(ankrd1a:EGFP) in injured skeletal muscle of adult zebrafish. А: three zebrafish per each timepoint were injured and left to recover for 1, 3, 5, 7, and 10 days before imaging. B: for longer timepoints, 3 zebrafish were injured. At 15 and 22 days postinjury (dpi), they were anaesthetized, imaged, and returned to the system water. At 30 dpi, they were euthanized, images were acquired, and tissue around the injury was used for RNA isolation. C: three zebrafish were injured, left to recover for 50 days, and imaged. Images of one representative zebrafish per experiment are shown. White arrowheads point to the fluorescence signal at the site of injury. The images on the same panel were acquired under the same conditions. Scale bar, 5 mm. EGFP, enhanced green fluorescent protein. |
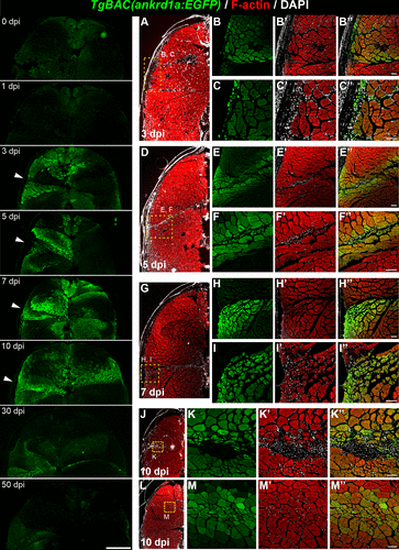
TgBAC(ankrd1a:EGFP) expression in injured skeletal muscle. Left: representative images of dorsal halves of zebrafish sections at designated timepoints after the injury (n = 3 for each time point). White arrowheads point to the needle entry site. Right: representative higher magnification images of cryosections obtained from injured zebrafish at 3 (B–B″, C–C″), 5 (E–E″, F–F″), 7 (H–H″, I–I″), and 10 (K–K″, M–M″) days postinjury (dpi) (n = 3 for each timepoint). Insets in lower magnification images (A, D, G, J, and L) delineate the area of higher magnification images on the right. Scale bars, 250 μm for the left panels and 50 μm for B–C″, E–F″, H–I″, K–K″, and M–M″. EGFP, enhanced green fluorescent protein. |
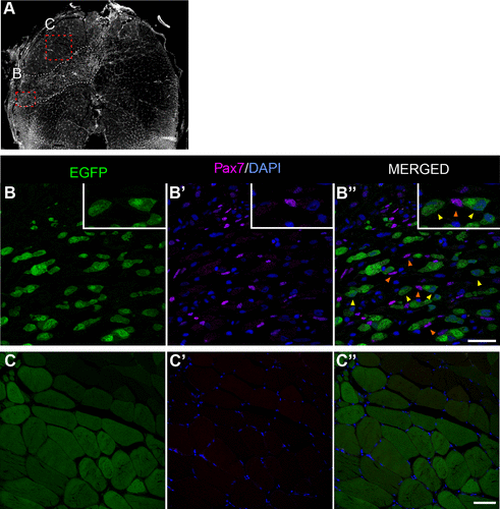
TgBAC(ankrd1a:EGFP) expression was not detected in activated satellite-like cells found within the injury area. Cryosections of injured skeletal muscle at 4 days postinjury (dpi) (n = 3) were immunostained with anti-Pax7 antibody, and nuclei were labeled with DAPI. A: low magnification image of the representative muscle section stained with DAPI, with delineated injury region (white dashed line) and positions of higher magnification images in injured (B–B″) and uninjured (C–C″) regions. Orange arrowheads on B″ point to some of the Pax7-positive nuclei as examples. Yellow arrowheads point to Pax7-negative myoblasts with visible nuclei. No Pax7-positive nuclei were detected in the adjacent uninjured region. Scale bars, 25 μm for B–B″ and 50 μm for C–C″. EGFP, enhanced green fluorescent protein. |
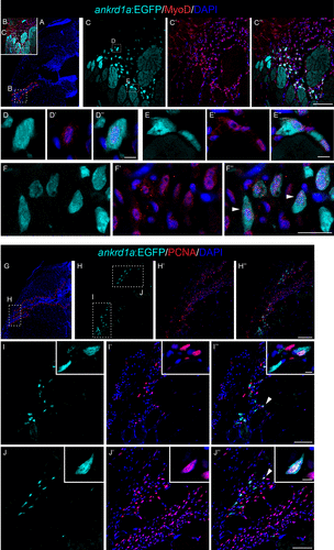
Myoblast-like (A–F″) and proliferating (G–J″) cells express TgBAC(ankrd1a:EGFP) in injured zebrafish skeletal muscle. Cryosections of zebrafish muscle at 4 days postinjury (dpi) (n = 3) were subjected to immunostaining for Myod1 and Pcna. A and G: low magnification images of the representative muscle section stained with DAPI, with delineated injury region (red dashed line) and positions of higher magnification images (C–C″ and H–H″). White arrowheads on F″—EGFP+ myoblast-like cells. White arrowheads on I″ and J″ point to cells magnified in insets. Scale bars, 100 μm for H–H″; 50 μm for C–C″, I–I″, and J–J″; 25 μm for F–F″; 5 μm for D–D″, E–E″, and insets in I and J. EGFP, enhanced green fluorescent protein. |
Newly forming myofibers express TgBAC(ankrd1a:EGFP). Cryosections of injured skeletal muscle of the reporter line TgBAC(ankrd1a:EGFP) (n = 3), at indicated timepoints, were stained for muscle markers: embryonic myosin Myh7 (A), myosin (B), tropomyosin (C), troponin C (D), and myozenin 1 (E). Nuclei were stained with DAPI. Low-magnification images are on the left with marked positions (dashed boxes) of higher-magnification images on the right. Elongated myofibers inside the injury area on B and D correspond to longitudinally cut fibers. Scale bars, 20 μm for A, 5 μm for insets in A, and 50 μm for B–E, for higher magnification images on the right. EGFP, enhanced green fluorescent protein. |
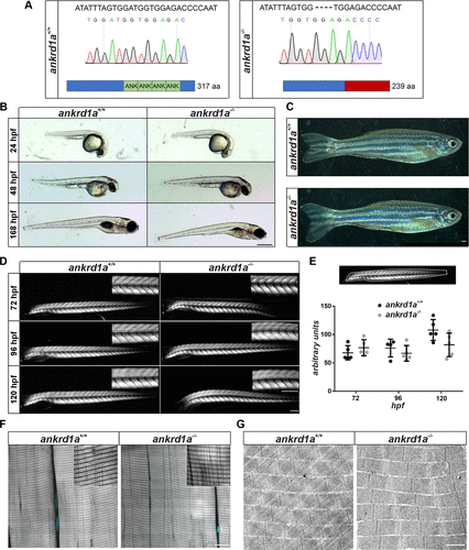
Characterization of ankrd1a mutant zebrafish. A: DNA sequences, electropherogram of ankrd1a+/+ and ankrd1a−/− alleles, and schematic representation of wild-type (wt) and mutant Ankrd1a protein structure. Hyphens indicate deleted bases, and ANK is ankyrin repeat. B: lateral view of wt (ankrd1a+/+) and ankrd1a mutant (ankrd1a−/−) embryos and larvae imaged at designated time points. Scale bar, 0.5 mm. C: appearance of adult ankrd1a+/+ and ankrd1a−/− zebrafish. Scale bar, 1 mm. D: birefringence analysis of ankrd1a−/− and ankrd1a+/+ somites at designated timepoints. Representative images are shown, n = 10 larvae per each timepoint and genotype. Lateral views, anterior to the left. Scale bar, 200 μm. E: birefringence quantification was performed within the outlined area and expressed as pixel intensities (gray values). No significant difference in muscle integrity between ankrd1a−/− and ankrd1a+/+ was observed (P > 0.05). F: Phalloidin staining of adult ankrd1a−/− and ankrd1a+/+ zebrafish skeletal muscle (n = 3) showed a characteristic striated pattern of actin filaments. Nuclei were stained with DAPI (cyan). Scale bars, 10 µm and 25 µm for insets. G: Transmission electron microscopy (TEM) analysis reveals regular sarcomere organization in ankrd1a−/− zebrafish (n = 4), with no pathological signs. Scale bar, 1 µm. F and G are representative images of one analyzed zebrafish. |

Histology and ultrastructure of the injury area in ankrd1a mutant and wild-type (wt) skeletal muscle at 5 days postinjury (dpi). Representative light microscopy (LM) images of ankrd1a+/+ (A) and ankrd1a−/− (B) skeletal muscle (n = 4). Muscle fibers are blue, collagen is pink. C–F: representative transmission electron microscopy (TEM) images of ankrd1a+/+ (C and D) and ankrd1a−/− (E and F) skeletal muscle. G–I: autophagic vesicles observed in ankrd1a+/+ (G) and ankrd1a−/− (H and I) skeletal muscle. J: macrophage detected in ankrd1a−/− skeletal muscle. Av and *, autophagy vesicle; ECM, extracellular matrix; M, myofiber; m, newly growing myofiber; Mb, myoblast; Mφ, macrophage. Scale bars, 20 µm for A and B and 1 µm for C and J. |
Representative examples of wounded skeletal muscle tissue in wild-type (wt) and ankrd1a mutant zebrafish at 7 days postinjury (dpi). Injury is recognized as an area without phalloidin-stained myofibers (red) and with nuclei accumulation (blue). Imaging was performed on sections of ankrd1a−/− and ankrd1a+/+ zebrafish (n = 4), which were age-matched and injured at the same time. White dashed lines delineate the remaining injured muscle tissue. Scale bar, 400 µm. |
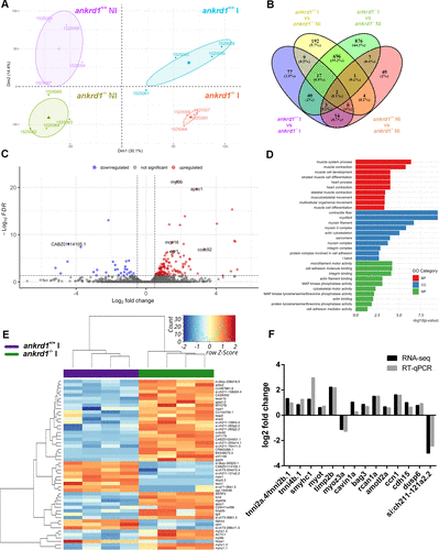
Transcriptomics analysis of injured ankrd1a mutant skeletal muscle at 5 days postinjury (dpi). A: PCA-plot depicting transcriptome heterogeneity between samples (n = 4 for each experimental group); B: Venn diagram indicating the number of overlapping significant DEGs among conditions. The numbers of genes contained in each intersection are indicated. C: volcano plot indicating DEGs between injured ankrd1a mutant and wild-type (wt) adult skeletal muscle; red dots, upregulated in mutant; blue dots, downregulated in mutant; gray dots, nonsignificant genes. D: summary of top 10 enriched GO terms in injured ankrd1a mutant vs. wt by category from the GO enrichment analysis. E: heatmap of the top 50 DEGs between injured ankrd1a mutant and wt skeletal muscle showing expression patterns across samples. The Z scores of gene expression measurements are displayed as colors ranging from blue to red. F: expression level of 14 selected DEGs was measured by RT-qPCR and compared with RNA-Seq data. Results are presented as log2 fold change. ankrd1a+/+, wt; ankrd1a−/−, ankrd1a mutant; BP, biological process; CC, cellular compartment; DEG, differentially expressed gene; I, injured; MF, molecular function; NI, noninjured. |
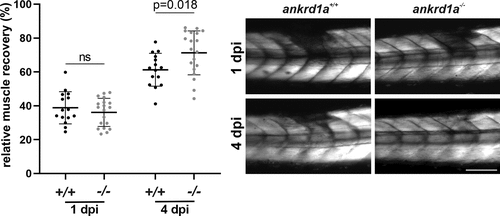
Relative skeletal muscle recovery in ankrd1a mutant (ankrd1a−/−) and wild-type (wt) (ankrd1a+/+) larvae injured by glass capillary at 72 h postfertilization (hpf). Muscle integrity was analyzed in 15 wt and 19 ankrd1a mutant larvae. Images were taken 1 and 4 days after the injury. Birefringence intensity was measured in LAS X software. Results are expressed as a percentage of signal intensity (gray values/µm2) in injured somites when the signal intensity of adjacent noninjured somites on both sides of the injury was set to 100%. Scale bar, 500 µm. ns, nonsignificant. |
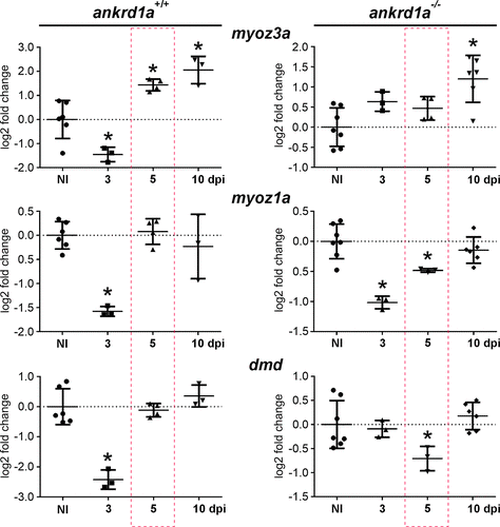
The expression of maturation markers myoz3a, myoz1a, and dmd is affected in ankrd1a mutant zebrafish during injury repair. qPCR was performed using RNA isolated from noninjured (NI) and injured muscle of both genotypes [wild-type (wt) and ankrd1a mutant] at 3, 5, and 10 days postinjury (dpi) (minimum 3 zebrafish for each timepoint). Red dashed rectangles emphasize results obtained at 5 dpi for easier comparison. Results are presented as log2 fold change ± SD. Statistical analysis was performed using the one-way ANOVA with Dunnett’s post hoc test. The exact P values are given in Supplemental Table S8. Average Ct values ± SD are listed in Supplemental Table S4. *P ≤ 0.05. |