
Fig. 10
- ID
- ZDB-FIG-250723-10
- Publication
- Milovanovic et al., 2025 - Activation of ankrd1a expression marks newly forming myofibers and regulates muscle cell differentiation in adult zebrafish skeletal muscle repair
- Other Figures
- All Figure Page
- Back to All Figure Page
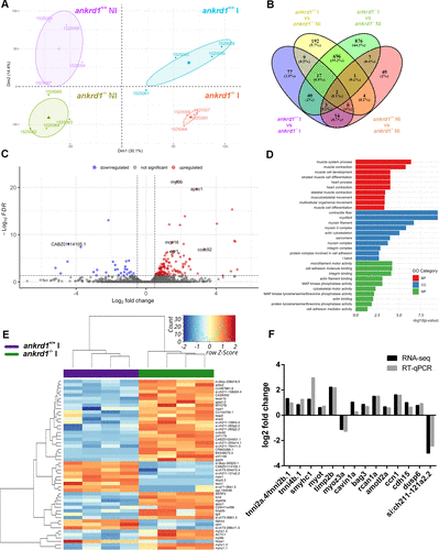
Transcriptomics analysis of injured ankrd1a mutant skeletal muscle at 5 days postinjury (dpi). A: PCA-plot depicting transcriptome heterogeneity between samples (n = 4 for each experimental group); B: Venn diagram indicating the number of overlapping significant DEGs among conditions. The numbers of genes contained in each intersection are indicated. C: volcano plot indicating DEGs between injured ankrd1a mutant and wild-type (wt) adult skeletal muscle; red dots, upregulated in mutant; blue dots, downregulated in mutant; gray dots, nonsignificant genes. D: summary of top 10 enriched GO terms in injured ankrd1a mutant vs. wt by category from the GO enrichment analysis. E: heatmap of the top 50 DEGs between injured ankrd1a mutant and wt skeletal muscle showing expression patterns across samples. The Z scores of gene expression measurements are displayed as colors ranging from blue to red. F: expression level of 14 selected DEGs was measured by RT-qPCR and compared with RNA-Seq data. Results are presented as log2 fold change. ankrd1a+/+, wt; ankrd1a−/−, ankrd1a mutant; BP, biological process; CC, cellular compartment; DEG, differentially expressed gene; I, injured; MF, molecular function; NI, noninjured. |