
|
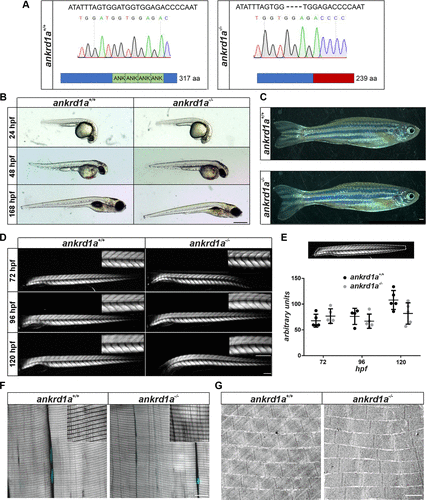
Fig. 7 Characterization of ankrd1a mutant zebrafish. A: DNA sequences, electropherogram of ankrd1a+/+ and ankrd1a−/− alleles, and schematic representation of wild-type (wt) and mutant Ankrd1a protein structure. Hyphens indicate deleted bases, and ANK is ankyrin repeat. B: lateral view of wt (ankrd1a+/+) and ankrd1a mutant (ankrd1a−/−) embryos and larvae imaged at designated time points. Scale bar, 0.5 mm. C: appearance of adult ankrd1a+/+ and ankrd1a−/− zebrafish. Scale bar, 1 mm. D: birefringence analysis of ankrd1a−/− and ankrd1a+/+ somites at designated timepoints. Representative images are shown, n = 10 larvae per each timepoint and genotype. Lateral views, anterior to the left. Scale bar, 200 μm. E: birefringence quantification was performed within the outlined area and expressed as pixel intensities (gray values). No significant difference in muscle integrity between ankrd1a−/− and ankrd1a+/+ was observed (P > 0.05). F: Phalloidin staining of adult ankrd1a−/− and ankrd1a+/+ zebrafish skeletal muscle (n = 3) showed a characteristic striated pattern of actin filaments. Nuclei were stained with DAPI (cyan). Scale bars, 10 µm and 25 µm for insets. G: Transmission electron microscopy (TEM) analysis reveals regular sarcomere organization in ankrd1a−/− zebrafish (n = 4), with no pathological signs. Scale bar, 1 µm. F and G are representative images of one analyzed zebrafish.