
|
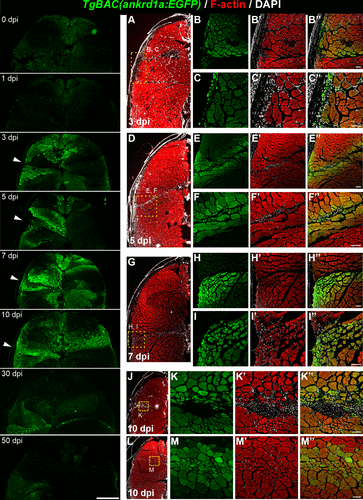
Fig. 3 TgBAC(ankrd1a:EGFP) expression in injured skeletal muscle. Left: representative images of dorsal halves of zebrafish sections at designated timepoints after the injury (n = 3 for each time point). White arrowheads point to the needle entry site. Right: representative higher magnification images of cryosections obtained from injured zebrafish at 3 (B–B″, C–C″), 5 (E–E″, F–F″), 7 (H–H″, I–I″), and 10 (K–K″, M–M″) days postinjury (dpi) (n = 3 for each timepoint). Insets in lower magnification images (A, D, G, J, and L) delineate the area of higher magnification images on the right. Scale bars, 250 μm for the left panels and 50 μm for B–C″, E–F″, H–I″, K–K″, and M–M″. EGFP, enhanced green fluorescent protein.