
- Title
-
The histamine pathway is a target to treat hepatic experimental erythropoietic protoporphyria
- Authors
- Kuo, N., Li, P., Cunha, J.B., Chen, L., Shavit, J.A., Omary, M.B.
- Source
- Full text @ Cell Mol Gastroenterol Hepatol
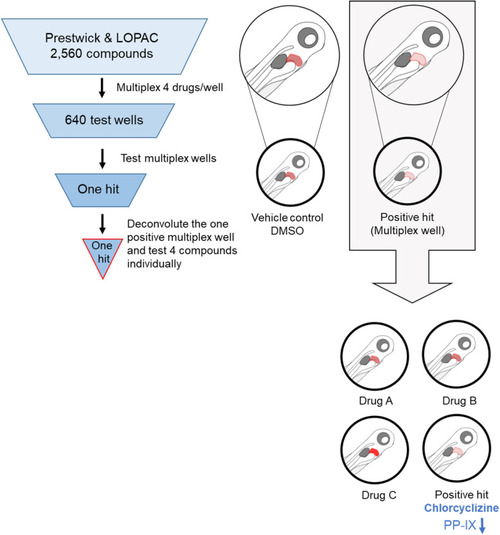
Schematic of the high-throughput drug screening in experimental EPP zebrafish. A total of 2560 compounds were multiplexed into 640 test wells. Positive hits were identified on the basis of significant reduction of the PP-IX (red) signal in EPP zebrafish livers (n ≥10 fish larvae; N ≥4 experiments). Funnel cartoons represent the progressive flow in the number of active compounds toward a validated optimal hit/compound for further investigation. Note the decrease in red liver fluorescence (right upper part of the schematic). |
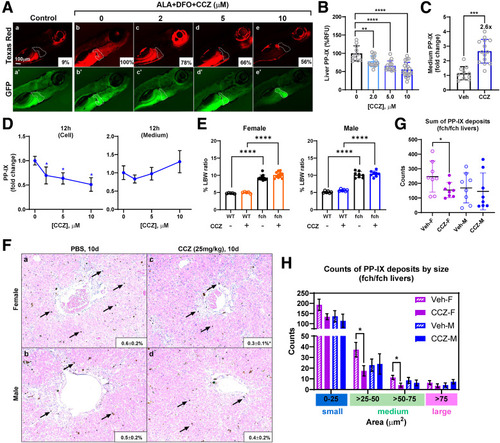
CCZ reduces PP-IX accumulation in experimental zebrafish, PMH, and fch/fch mouse EPP models. (A) Representative fluorescence images of EPP zebrafish larvae treated with the vehicle DMSO and CCZ at indicated concentrations. (B) Quantification of zebrafish liver PP-IX fluorescence as mean ± SD (9 ± 4%, 100 ± 20%, 78 ± 15%, 66 ± 14%, 56 ± 20%). (C) PP-IX levels in the zebrafish culture medium normalized to the level in the DMSO-treated controls (n ≥10 larvae per condition, N = 4 experiments). (D) Freshly isolated hepatocytes from FVB/N mice were treated with vehicle or ALA + DFO for 12 hours. Relative PP-IX fluorescence in the hepatocytes and culture medium is shown normalized to the level in the untreated ALA + DFO group. Data are shown as mean ± SD (N = 4 experiments). (E) fch/fch mice manifest increased % liver-to-body weight (LBW) ratio that is nearly double the ratio of wild-type (WT) mice (female fch: 9.3 ± 0.8%; female WT: 4.8 ± 0.1%; male fch: 10 ± 0.9%; male WT: 5.1 ± 0.3%). CCZ does not alter the LBW ratio. Data are shown as mean ± SD (n = 5–8 mice per group, N = 2 experiments). Statistical analysis was performed using the 1-way ANOVA test, ∗∗∗∗P < .0001. (F) fch/fch male and female mice were treated with PBS or CCZ. Representative H&E liver sections and quantification of PP-IX area in the male and female fch/fch mice is shown. Arrows indicate medium-sized PP-IX deposits (n = 8 mice per group, N = 2 experiments). (G) Quantification of total PP-IX counts in male (M) and female (F) fch/fch livers treated with vehicle (Veh/PBS) or CCZ. (H) Quantification of small-, medium-, and large-sized PP-IX deposits. Data are shown as mean ± SD (n = 8 mice/group, N = 2 experiments). For panels (B–D) and (F–H) statistical analysis was performed by 2-tailed Student t-test. ∗∗∗∗P < .0001; ∗∗∗P < .001; ∗∗P < .01; ∗P < .05. |
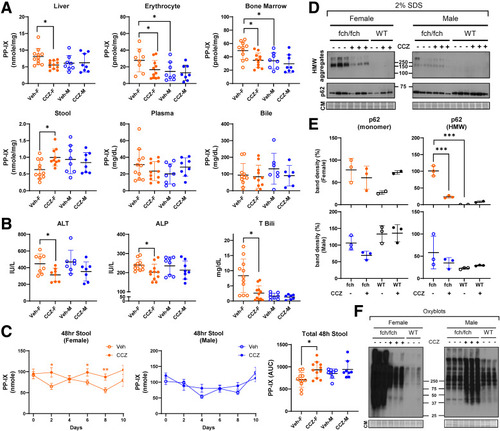
CCZ reduces tissue PP-IX levels and liver injury and protein oxidation in female but not male fch/fch mice. (A) PP-IX levels in the liver, erythrocytes, bone marrow, internal rectal stool, plasma, and bile. (B) Plasma ALT, ALP, and total bilirubin levels. (C) Cage stool was collected every 48 hours. Stool PP-IX levels were then measured. Total stool PP-IX level over the 10-day study period was calculated using the integrated area under the fluorescence curve. Data are shown as mean ± SD (n = 8–11 mice/group, N = 2 experiments). Statistical analysis was performed by ANOVA test, ∗P < .05. (D) Immunoblots of p62 monomer and its high molecular weight aggregates in 2% SDS-containing buffer. (E) Densitometry analysis of p62 monomer and high molecular weight aggregates. Statistical analysis was performed by 2-tailed Student t-test, ∗∗∗P < .001. (F) Oxyblots of total fch/fch or wild-type livers treated with the vehicle PBS or CCZ. CM, Coomassie staining. |
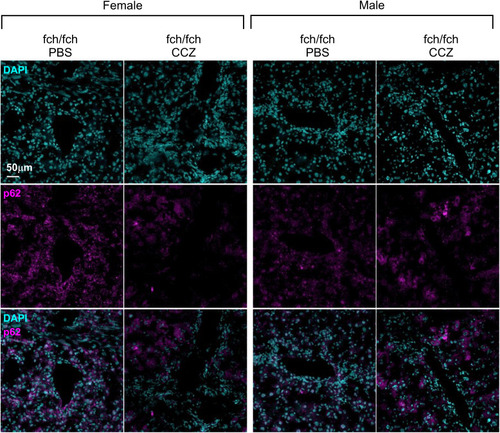
p62 immune staining of liver sections from fch/fch mice treated with vehicle (PBS) or CCZ. Representative images of liver sections isolated from female and male fch/fch mice, that were administered PBS or CCZ, were stained with DAPI (to label nuclei) and anti-p62 antibody. Female but not male livers showed reduced p62 staining (displayed in pink) |
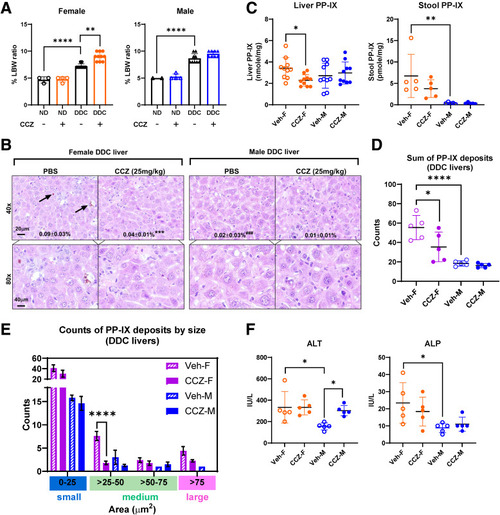
Effect of CCZ on PP-IX levels and liver injury in DDC-fed mice. (A) Prominent liver-to-body weight ratio (LBW) was observed in mice fed with DDC-containing diet for 5 days (female DDC: 7.2 ± 0.4%; female normal diet [ND]: 4.7 ± 0.6%; male DDC: 8.7 ± 0.9%; male ND: 5.0 ± 0.1%). CCZ further increases the liver-to-body weight ratio in the DDC-fed female mice (female DDC + CCZ: 9.0 ± 0.8%). Data are shown as mean ± SD (n = 2–10 mice per group, N = 2). Statistical analysis was performed using the 1-way ANOVA test. ∗∗∗∗P < .0001; ∗∗P < .01. (B) Representative H&E liver sections and quantification of PP-IX deposit area in the livers of DDC-fed mice treated with PBS or CCZ. Arrows indicate PP-IX deposits. ∗∗∗ (P < .001) when comparing PBS with CCZ in females; ### (P < .001) when comparing PBS with CCZ in male mice. (C) PP-IX levels in the liver and stool isolated from the rectum. (D) Quantification of total PP-IX deposits in livers isolated from DDC-fed (5 days) mice. (E) Quantification of small-, medium-, and large-sized PP-IX deposits in the livers of DDC-fed mice. (F) Plasma ALT and ALP levels. Data are shown as mean ± SD (n = 5–10 mice per group, N = 2). Statistical analysis was performed using the 1-way ANOVA test. ∗∗∗∗P < .0001; ∗∗∗P < .001; ∗∗P < .01; ∗P < .05. |
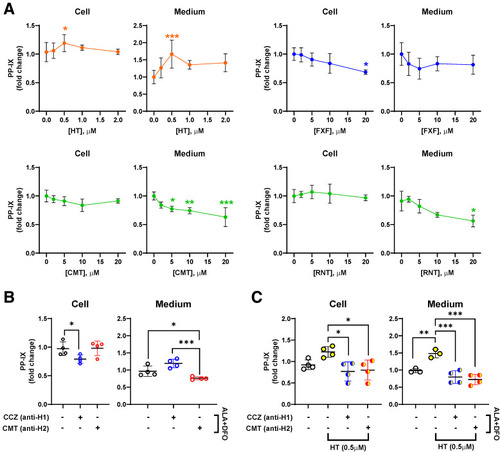
The role of the histamine pathway in porphyrin-stressed PMHs. Primary mouse hepatocytes (PMHs) were challenged with ALA + DFO that results in porphyrin accumulation, then treated with histamine (HT), CCZ, or other histamine blockers for 12 hours. (A) PMHs were treated with HT, the H1-blocker fexofenadine (FXF), and the H2-blockers cimetidine (CMT) and ranitidine (RNT) at the indicated doses. Intracellular and culture medium PP-IX levels following the treatments are shown. (B) CCZ and CMT were tested individually at 10 μM. Intracellular and medium PP-IX levels were measured in the absence of histamine. (C) CCZ and CMT were tested individually at 10 μM by treating primary mouse hepatocyte cultures. Intracellular and culture medium PP-IX levels in the presence or absence of histamine with levels relative to the condition without histamine. Data are shown as mean ± SD (n ≥3 experiments). Statistical analysis was performed by 1-way ANOVA test, ∗∗∗P < .001; ∗∗P < .01; ∗P < .05. |
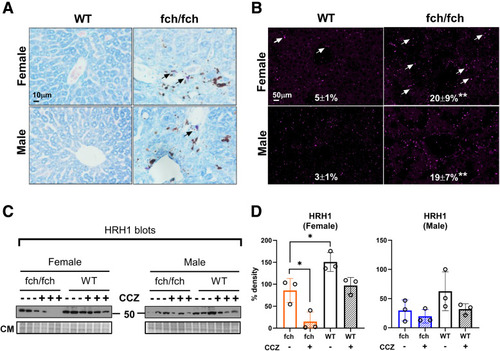
MC presence and HRH1 expression in wild-type and fch/fch livers. (A) May-Grunwald Giemsa staining of wild-type and fch/fch livers. Mast cell staining is highlighted by black arrows. (B) Immunofluorescence staining of MCP1 in wild-type (WT) and fch/fch livers (MCP1 puncta are indicated by white arrows) with quantified relative staining shown. The MCP1 staining images of the fch/fch (PBS) group in figures 7B (right panels) and 8A (first and third panels from left) were taken from a representative mouse liver section. Quantification is based on a group of immunofluorescence stainings (n = 3 livers, 2 image fields per liver). Another group (n = 2 livers, 2 images fields per liver) manifested a similar trend. (C) Immunoblots of the histamine receptor H1 (HRH1) in total liver lysates obtained from fch/fch and WT female and male mice with or without treatment with CCZ. (D) Densitometry analysis of HRH1 expression shown in panel C. HRH1 expression is suppressed in female fch/fch mice when compared with their WT controls, and CCZ further decreases HRH1 expression preferentially in female livers. Data are shown as mean ± SD (n = 3 livers/group). Statistical analysis was performed using the 1-way ANOVA test, ∗P < .05. |
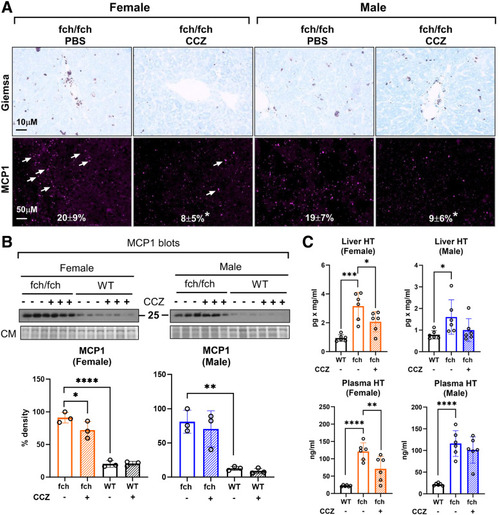
CCZ reduces MC presence and histamine levels in the female liver and plasma. (A) May-Grunwald Giemsa staining and immunofluorescence staining of mast cell protease 1 (MCP1) on fch/fch and wild-type livers. MCP1 puncta are indicated by white arrows. Expressions of MCP1 puncta are shown as mean percent cell area ± SD (n = 3 livers, 2 image fields/liver). (B) Immunoblot and densitometry analysis of MCP1 in fch/fch and wild-type livers (n = 3 livers/group). CM, Coomassie staining. (C) Histamine levels in the liver and plasma. Data are shown as mean ± SD (n = 6 mice/group). Statistical analysis was performed by 1-way ANOVA test, ∗∗∗∗P < .0001; ∗∗∗P < .001; ∗∗P < .01; ∗P < .05. |
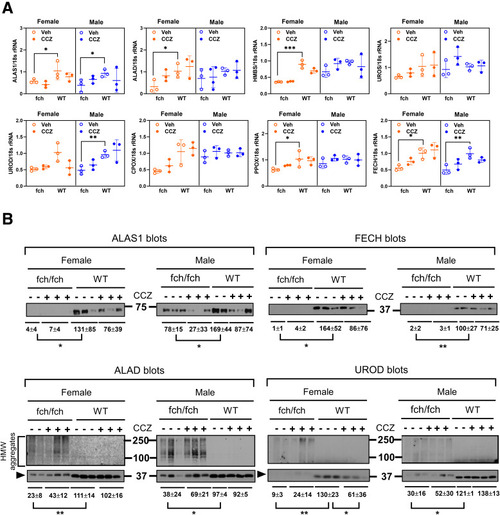
Gene mRNA and protein expressions of heme biosynthesis enzymes. (A) ALAS1, ALAD, HMBS, PPOX, and FECH gene expressions are suppressed in the female fch/fch liver. ALAS1, UROD, and FECH gene expressions are suppressed in the male fch/fch liver. (B) Standard immunoblotting was carried with similar protein loading for each of the displayed panels. The ALAS1, FECH, ALAD, and UROD protein expression is suppressed in the fch/fch livers. Under the experimental conditions used in this study, HMW aggregates of ALAD and UROD (and not ALAS1 or FECH) were detected in the fch/fch livers. There is an upward shift in ALAD and UROD monomers as indicated by the arrowheads. Data are shown as mean ± SD (n = 2–3 livers per group). Statistical analysis was performed by 1-way ANOVA test, ∗∗∗P < .001; ∗∗P < .01; ∗P < .05 |
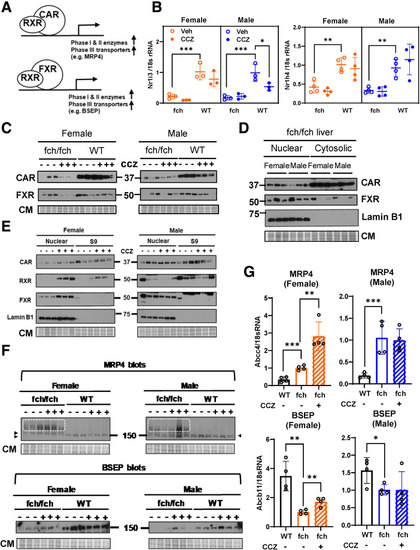
Expression and subcellular partitioning of CAR and FXR. (A) Schematic diagram of the CAR/RXR and FXR/RXR gene transactivation system. (B) Relative mRNA expressions of Nr1i3/CAR and Nr1h4/FXR in female and male fch/fch vs wild-type (WT) livers (±CCZ). In WT male livers, CCZ treatment decreased CAR gene expression. (C) CAR and FXR protein expression is suppressed in fch/fch liver. CCZ administration decreases CAR and FXR protein expression further in livers of female fch/fch mice. (D) Liver homogenates were separated into nuclear- and cytoplasmic-enriched fractions. Baseline CAR and FXR expression is comparable in female and male fch/fch livers. Lamin B1 is used as a nuclear marker. Coomassie staining (CM) is included to show equal protein loading. (E) CCZ enriches nuclear localization of CAR, RXR, and FXR in female fch/fch livers. (F) Relative protein expression of MRP4 and BSEP. The MRP4 monomer is indicated by arrowhead. High molecular weight aggregates of MRP4 are highlighted by white dotted boxes. (G) Relative mRNA expression of MRP4 (upper row) and BSEP (lower row) in livers of female and male fch/fch (±CCZ) and WT mice. Statistical analysis was performed using the 1-way ANOVA test. ∗∗∗P < .001; ∗∗P < .01; ∗P < .05. |
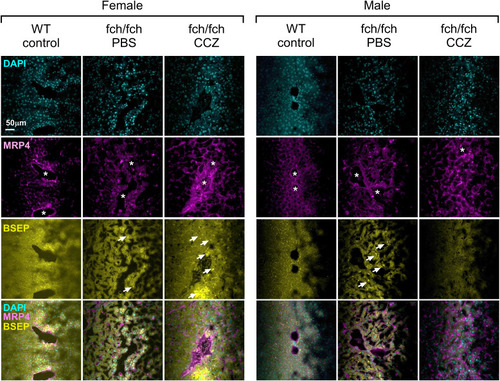
MRP4 and BSEP immunostaining in PBS- and CCZ-treated fch/fch livers. Representative images of liver sections stained with DAPI (to label nuclei) and anti-MRP4 and anti-BSEP antibodies. The MRP4 (pink) and BSEP (yellow) signal increases in the female livers following CCZ treatment. Asterisks indicate large bile ducts. White arrows indicate apical BSEP transporters that appear as yellow lines. |
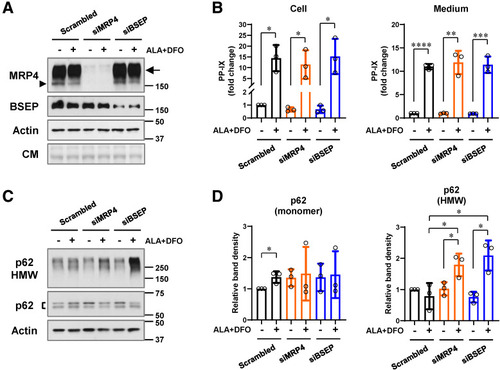
Effect of MRP4 and BSEP siRNA knockdown in ALA+DFO-treated PMH. (A, B) PMH were cultured with scrambled, MRP4, or BSEP siRNA (24 hours) followed by treatment with ALA + DFO (1 mM and 100 μM, respectively) for 12 hours. (A) Immunoblot analyses using antibodies to MRP4 and BSEP. Coomassie staining (CM) and actin blots are included to show equal loading. The MRP4 monomer is indicated by arrowhead. HMW aggregates of MRP4 are highlighted by an arrow. (B) Intracellular and culture medium PP-IX levels following the treatments are shown. (C) Immunoblots of p62 monomer doublet (detected as a doublet due to transfection conditions) and its HMW aggregates in total hepatocyte lysates. Actin blot is included as a loading control. (D) Relative densities of the p62 species from 3 individual experiments were quantified. For panels B and D, data are shown as mean ± SD (N = 3 experiments). Statistical analysis was performed by 2-tailed Student t-test, ∗∗∗∗P < .0001; ∗∗∗P < .001; ∗∗P < .01; ∗P < .05. |